Diameter chart
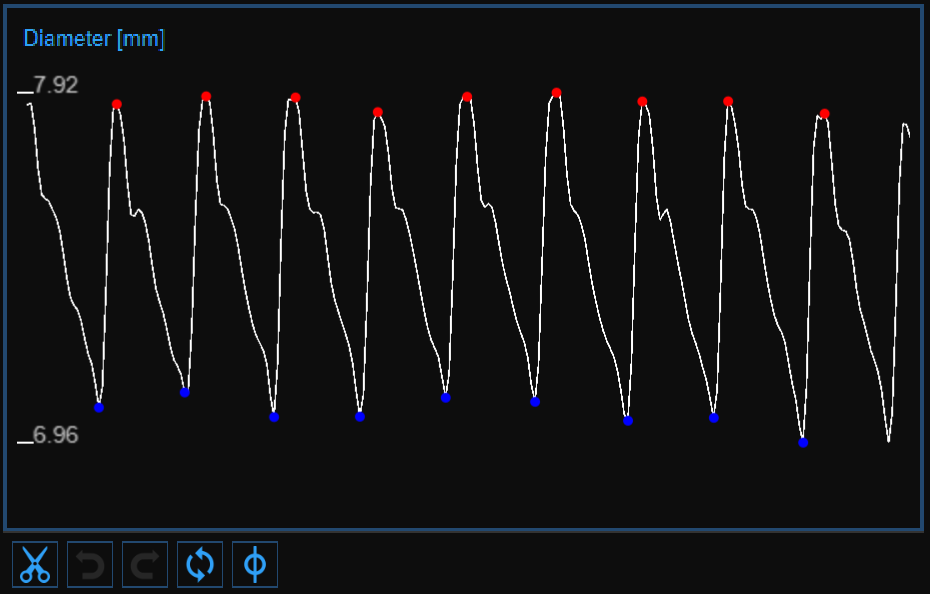
The chart shows the trend of the diameter. The buttons on the bottom can be used for editing the chart and removing the outliers.
Remove the outliers
Click on the Cut
 button. The heart cycle will be highlighted in the diameter chart.
Click on the cardiac cycles you want to remove.
Once you have removed the outliers, the data on the Results panel will be automatically updated.
You can use the undo ![]() and redo
and redo ![]() buttons to cancel and restore your changes. The Restore
buttons to cancel and restore your changes. The Restore ![]() button cancels all your changes and restore original data.
button cancels all your changes and restore original data.
Click on the Save ![]() button in the Top Bar to save your changes to the document.
button in the Top Bar to save your changes to the document.
Graph cursors
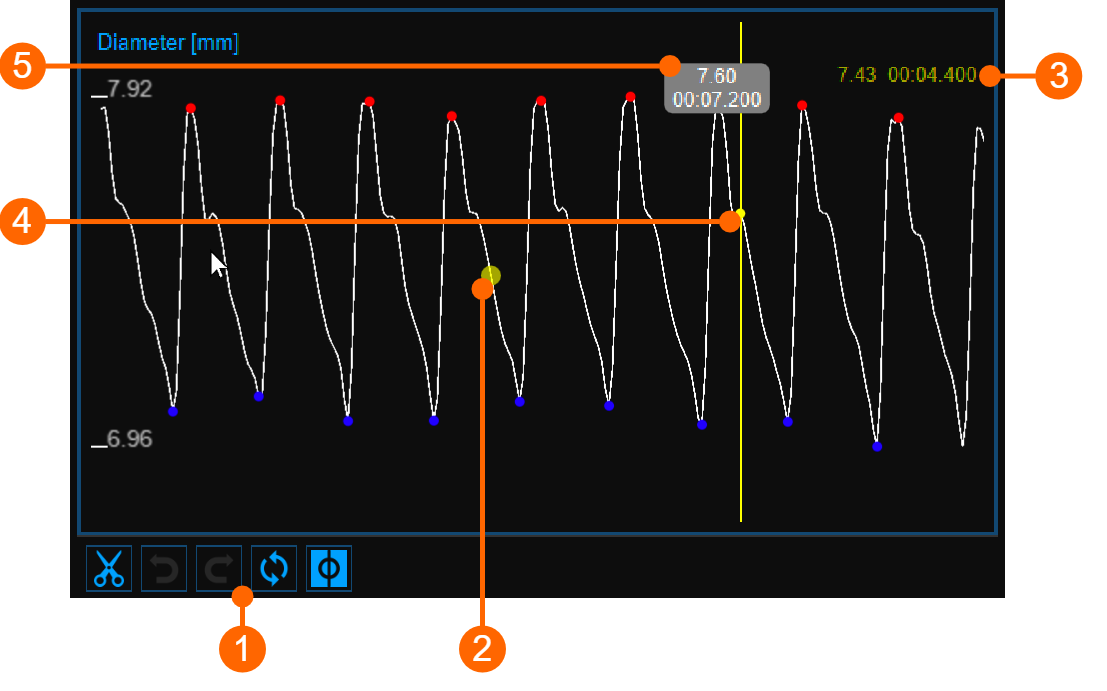
As shown in the following figure, the Cursor ![]() button (1) activates a cursor (2) on the Diameter chart that shows the current time position on the graph according to the images shown in the Video window. The coordinates (diameter value in millimeters and time value in the format minutes:seconds.milliseconds) of the cursor are dynamically updated and shown in (3). When the Cursor button is active, it is also possible to know the coordinates of an exact point in the graph; it is only needed to hover over the chart and a second cursor (4) is displayed. It follows the mouse movements and the exact coordinates of the point are shown in the label (5) (diameter value is expressed in millimeters and the time value has the format minutes:seconds.milliseconds).
button (1) activates a cursor (2) on the Diameter chart that shows the current time position on the graph according to the images shown in the Video window. The coordinates (diameter value in millimeters and time value in the format minutes:seconds.milliseconds) of the cursor are dynamically updated and shown in (3). When the Cursor button is active, it is also possible to know the coordinates of an exact point in the graph; it is only needed to hover over the chart and a second cursor (4) is displayed. It follows the mouse movements and the exact coordinates of the point are shown in the label (5) (diameter value is expressed in millimeters and the time value has the format minutes:seconds.milliseconds).