Doppler flow analysis
FMD Studio computes the envelope of the Doppler flow velocity waveform over the time interval defined by the Doppler flow ROI. The result is used to compute the Time Average Wall Shear Rate.
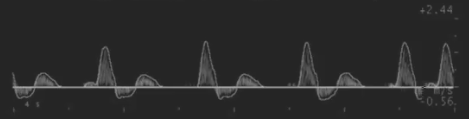
We assume the velocity profile to be parabolic and we assume that the Doppler flow velocity waveform provides the maximum value (VM) of the velocity profile (i.e. the maximum spatial velocity). In fact, the analysis is based only on the Doppler flow envelope because the video image data does not give information on the velocity profile of the vessel.
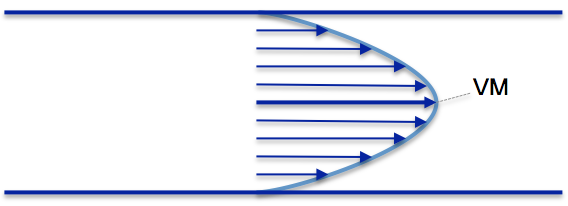
Velocity Profile in a vessel
With this assumptions, the Shear Rate (SR) can be computed as:
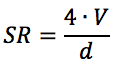
where d is the diameter of the vessel.
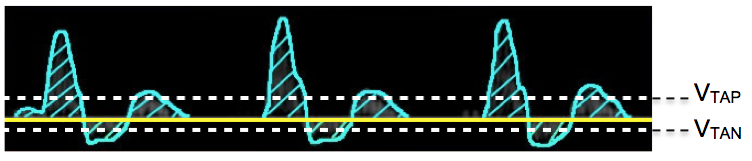
FMD Studio computes two values for velocity:
VTAP : time averaged of the positive values of V.
VTAN : time averaged of the negative values of V.
Both the averages are computed over the Doppler flow ROI.
These two values are used to compute the Shear Rate as:
SRTAP : Time Average Positive wall Shear Rate.
SRTAN : Time Average Negative wall Shear Rate.