Diameter chart
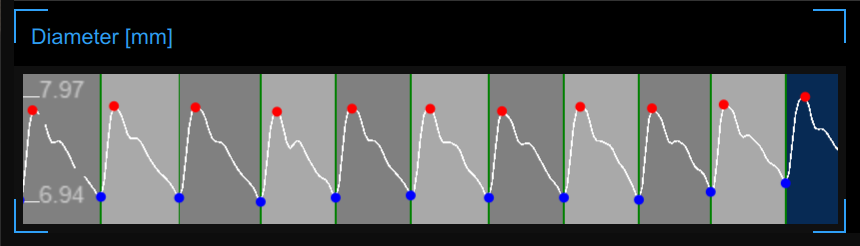
The chart shows the trend of the diameter during the examination. During the analysis, Carotid Studio recognizes the heart cycles that are shown in dark and light gray alternatively. The red points in the chart are the systolic diameters and the blue points are the diastolic diameters.