Plaque analysis
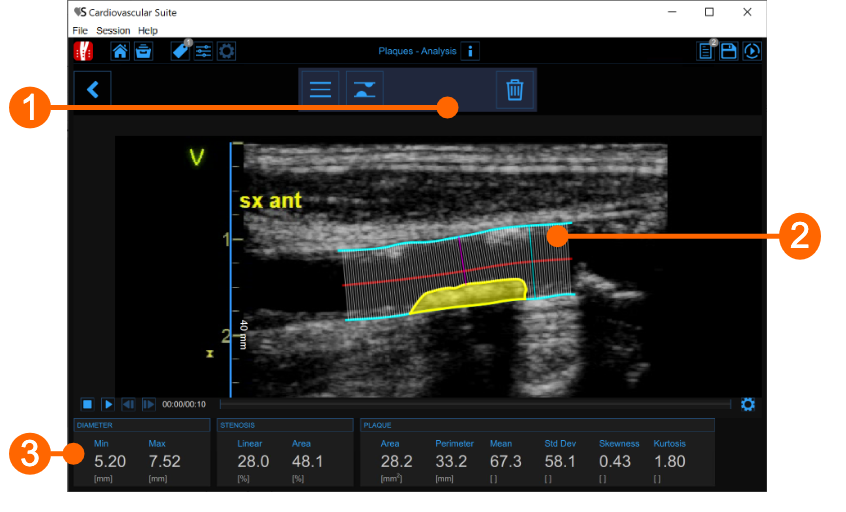
The plaque analysis window contains the following components:
Setup panel
It contains the controls for tracing of the vessel borders, drawing a plaque and delete it.Plaque analysis tool
The Trace borders button is used to manually trace the borders of the vessel. The user has to trace point-by-point the vessel edges and the software interpolates them. It is possible to modify the points by dragging them, as shown in the following picture.
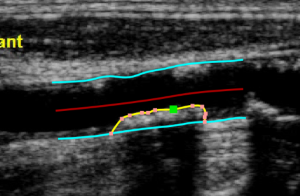
After the two borders are traced, the software automatically compute the minimum and maximum values of the diameter and the linear and circular values of the stenosis. The Draw plaque button is used to manually draw the profile of a plaque. The user has to trace point-by-point the plaque profile and the software interpolates them. Also in this case, it is possible to modify the points by dragging them and to delete a plaque, as shown in the following picture.
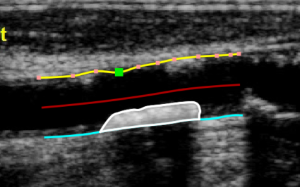
After the plaque is drawn, the software automatically computes its area, perimeter, and the mean, standard deviation, skewness, and kurtosis of its grey level.Data panel
This panel contains the computed values. In particular, it shows the minimum and maximum values of the diameter and the linear and circular values of the stenosis. In addition, if a plaque has been drawn, it also displays its area and perimeter, and the mean, standard deviation, skewness, and kurtosis value of its grey level.