Doppler flow analysis
The Doppler analysis computes the envelope of the Doppler flow velocity waveform over the time interval defined by the Doppler ROI.
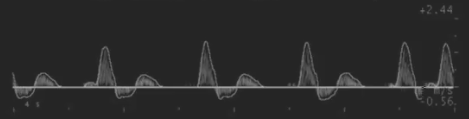
We assume the velocity profile to be parabolic and we assume that the Doppler flow velocity waveform provides the maximum value (VM) of the velocity profile (i.e. the maximum spatial velocity). In fact, the analysis is based only on the Doppler flow envelope because the video image data does not give information on the velocity profile of the vessel.
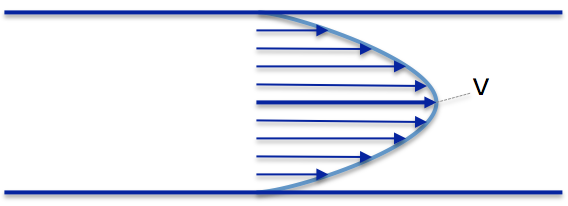
Velocity Profile in a vessel
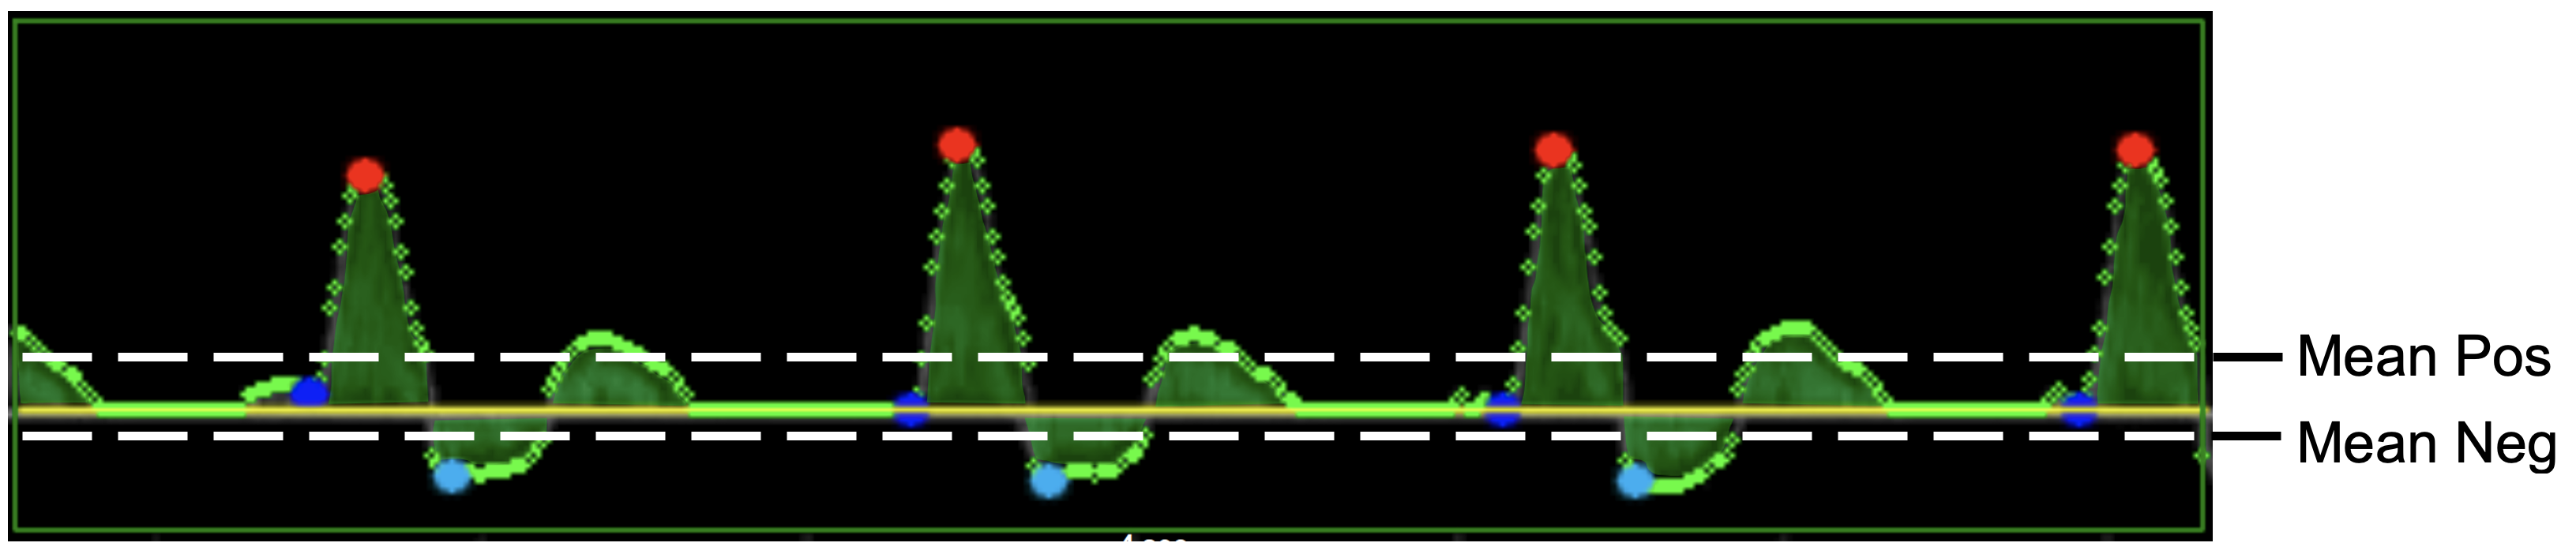
The following values are computed:
Mean Pos: time averaged of the positive values of V.
Mean Neg: time averaged of the negative values of V.
Max: average of the local maxima values of V.
Min: average of the local minima values of V.
Min Pos: average of the local positive minima values of V.
The averages are computed over the Doppler ROI.
In FMD Studio, the velocity is used to compute the Shear Rate (SR). With the assumption of parabolic velocity profile, the SR is computed as:
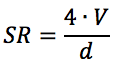
where d is the diameter of the vessel.
Two results are provided:
Positive Shear Rate, computed using the Mean Pos velocity.
Negative Shear Rate, computed using the Mean Neg velocity.