Setup panel
The Setup Panel contains the commands that are used to setup the analysis. The panel is automatically shown when the analysis windows is open, and can be hidden or shown by the Show/Hide Setup Panel ![]() button.
button.
The Previous ![]() and Next
and Next ![]() buttons can be used for the navigation into the Setup Panel.
buttons can be used for the navigation into the Setup Panel.
B-mode image setup
B-Mode Calibration
These commands must be used to Calibrating the B-mode image.
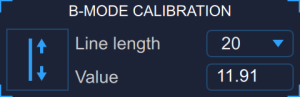
The Trace the Line ![]() button enables tracing the calibration line.
button enables tracing the calibration line.
The drop-down menu selects the length of the line used for the calibration.
The numeric display shows the calibration value.
I f you click in the numeric display, you can manually enter the calibration value (to be used when the value is knows).
B-Mode ROI
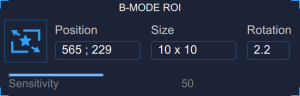
The Draw the ROI ![]() button enables drawing the ROI.
button enables drawing the ROI.
The first numeric display shows the center position, in pixels, of the ROI.
The second numeric display shows the size (width x height), in pixels, of the ROI.
The third numeric display shows the rotation, in degrees, of the ROI.
The slider sets the sensitivity of the B-Mode analysis, which can be used to optimise the detection of the intima-media border and the media-adventitia border.
I f you click in the numeric display, you can manually enter the calibration value (to be used when the value is knows).
Blood Pressure
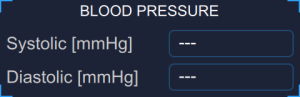
This panel contains the systolic and diastolic blood pressure value. Click the numeric display to manually enter the blood pressure values values.
If present, these values will be used to compute the stiffness parameters. For this purpose, the local carotid pressure should be used: in this case the carotid waveform is obtained by tonometer or similar device and it is generally calibrated by brachial measurement (sphygmomanometer) assuming that mean and diastolic values are constant along the arterial tree. For more information you can see:
"Reference values for local arterial stiffness. Part A: Carotid artery", Engelen L, Bossuyt J, Ferreira I et al., J Hypertens. 2015 Oct;33(10):1981-96
"Expert consensus document on arterial stiffness: methodological issues and clinical applications.", S. Laurent, J. Cockcroft, L. Van Bortel et al., Eur Heart J. 2006 Nov;27(21):2588-605
Doppler setup
The Doppler analysis is enabled by clicking the Doppler Enable button. ![]()
Doppler ROI
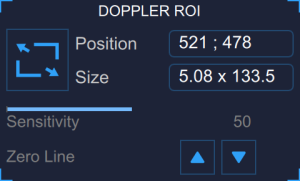
T
he Draw the ROI ![]() button enables drawing the ROI.
button enables drawing the ROI.
The first numeric display shows the center position, in pixels, of the ROI.
The second numeric display shows the size (width x height), in pixels, of the ROI.
The slider sets the sensitivity of the Doppler analysis, which can be used to optimise the detection of the Doppler velocity waveform.
The Zero Line Move up/down ![]()
![]() buttons moves up and down the zero line. These commands can be used in case the automatic detection of the zero line is not precise.
buttons moves up and down the zero line. These commands can be used in case the automatic detection of the zero line is not precise.
Doppler X calibration
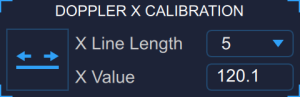
The Trace the Line [sec] ![]() button enables tracing the x calibration line (time).
button enables tracing the x calibration line (time).
The drop-down menu selects the length of the line used for the x calibration (sec).
The numeric display shows the x-calibration value (pix/sec).
I f you click in the numeric display, you can manually enter the x calibration value (to be used when the value is knows).
Doppler Y calibration
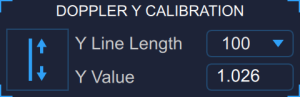
The Trace the Line [cm/sec] ![]() button enables tracing the y calibration line (velocity).
button enables tracing the y calibration line (velocity).
The drop-down menu selects the length of the line used for the y calibration (cm/sec).
The numeric display shows the y-calibration value (pix/cm/sec).
I f you click in the numeric display, you can manually enter the y calibration value (to be used when the value is knows).
Plaque analysis

The Trace the borders ![]() button enables tracing the borders of the vessel. The user has to trace point-by-point the vessel edges and the software interpolates them.
button enables tracing the borders of the vessel. The user has to trace point-by-point the vessel edges and the software interpolates them.
The Trace the plaques ![]() button enables tracing a plaque.
button enables tracing a plaque.
The Delete the selected plaque ![]() button deletes a plaque.
button deletes a plaque.