This panel consists of two tab-sheets: Results panel and Other info panel.
Results panel
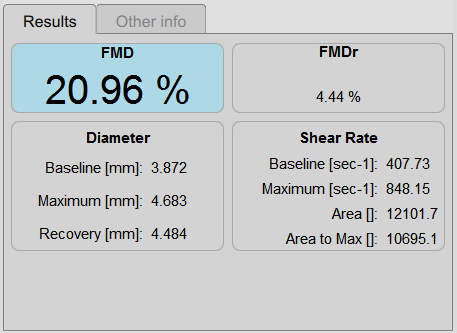
The panel shows the results of the analysis. The following data are displayed:
Baseline Diameter [mm]: mean of the diameter values in the "Baseline" time interval.
Maximum Diameter [mm]: maximum diameter value in the "Vasodilation" time interval.
Recovery Diameter [mm]: mean of the last 30 seconds of diameter values available in the "Vasodilation" time interval.
Baseline Shear Rate [s-1]: mean of the shear rate values in the Baseline time interval.
Maximum Shear Rate[s-1]: maximum of the shear rate values in the Vasodilation time interval.
Area of the Shear Rate [dimensionless]: area under the curve of the shear rate in the Vasodilation time interval, calculated with reference to the baseline shear rate value.
Area to Max of the Shear Rate [dimensionless]: area under the curve of the shear rate in the time interval that begins with the Vasodilation and ends at the time of the Maximum Diameter, calculated with reference to the baseline shear rate value.
FMD [%]: Flow Mediated Dilation
![]()
FMDr [%]: Flow Mediated Dilation with respect to the Recovery Diameter
![]()
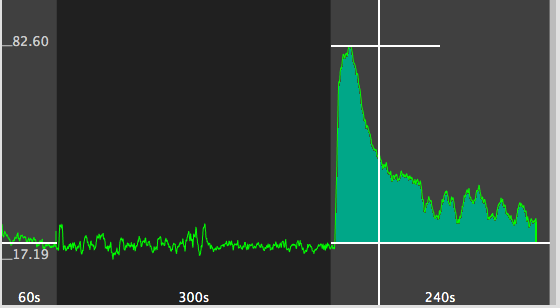
Area of the Shear Rate
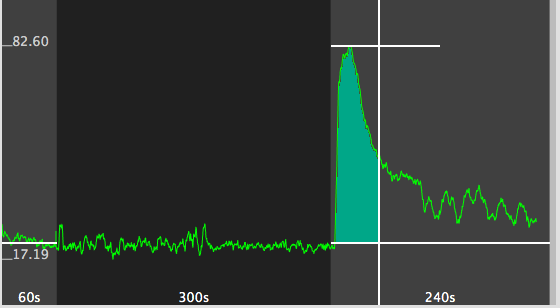
Area to Max of the Shear Rate
These data can be exported in the Document Data. Please see Export and Save.
Other info panel
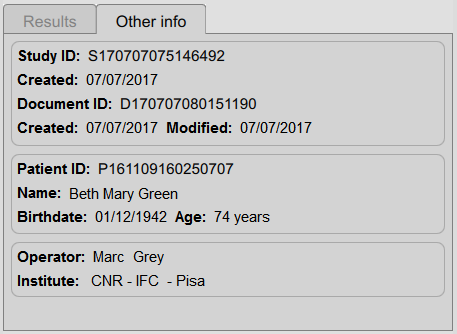
The panel shows the information about the study, the document, the patient, the operator and the institute.