Mean diameter chart
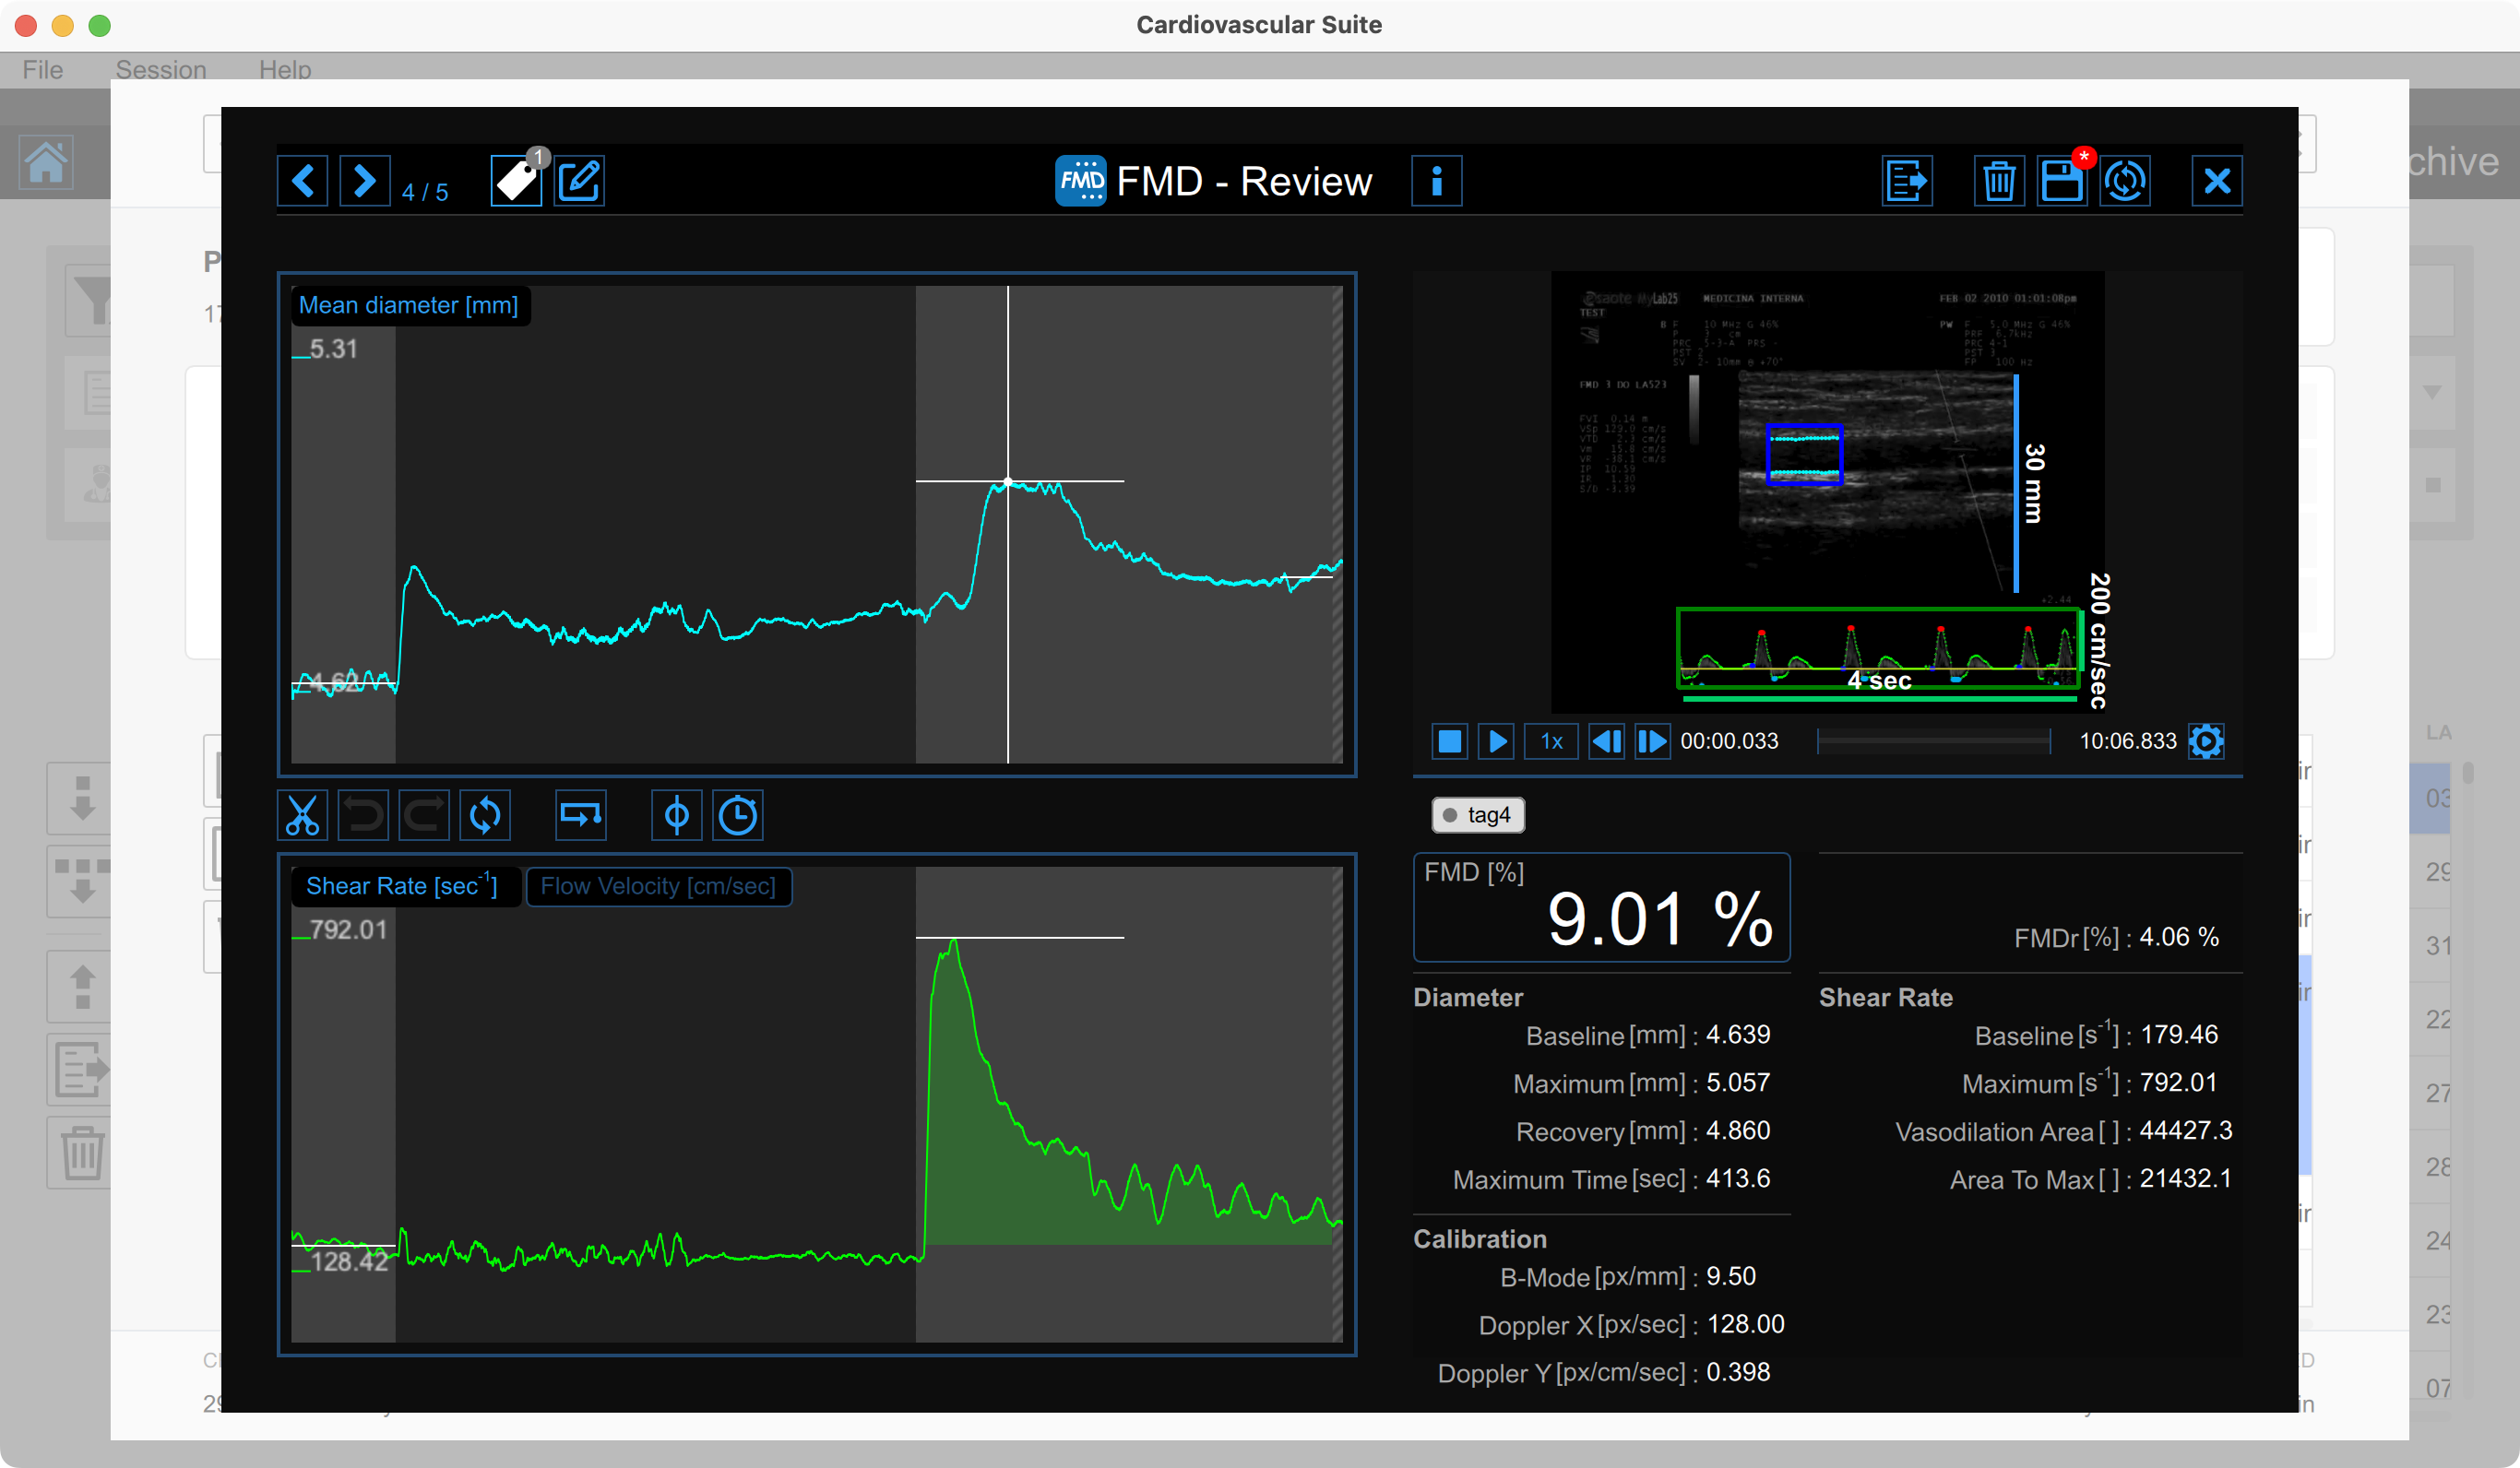
The Review window shows the result of the analysis and allows you to remove piece of data that are considered to be "outliers".
Mean diameter chart
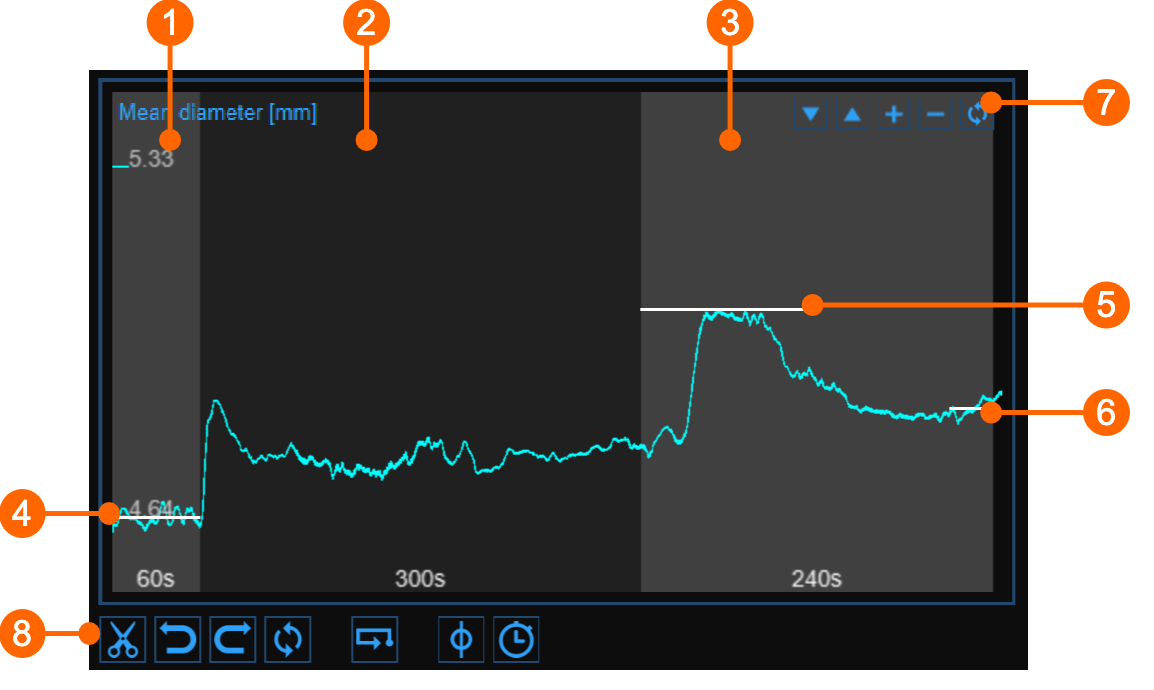
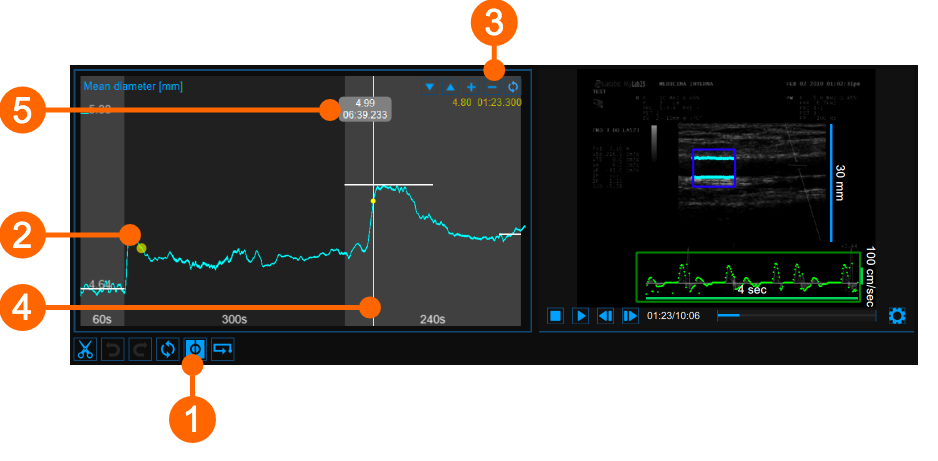
The chart shows the trend of the mean diameter during the examination. The chart is divided into three or two parts, according to the study modality. You have basal (1), ischemia (2) and vasodilation (3) intervals in FMD; ischemia is missing in vasodilation modality.
In the chart, three cursors are present (two cursors in "Vasodilation" study mode): the first one (4) is places at the baseline diameter value; the second one (5) is placed at the maximum diameter value in vasodilation; the third one (6) is placed at the post baseline (this cursors is absent in "Vasodilation" study modality). Cardiovascular Suite places the cursors at the position automatically computed at the end of the analysis. You can manually place these values if you see that some outliers have affected the automatic analysis.
These values are shown in the Results panel.
Using the buttons at the top right (7) you can move up ![]() or down
or down ![]() the chart, enlarge
the chart, enlarge ![]() or reduce
or reduce ![]() the vertical scale or restore
the vertical scale or restore ![]() the default view.
the default view.
The buttons under the chart (8) can be used for editing the chart in order to remove the outliers, for activating the graph cursor, and for modifying the timeline.
Removing the outliers
Click the Cut
 button.
In the Mean diameter chart, click on one of the two extremes of the range to be deleted.
Drag the mouse horizontally to the other extreme of the range to be deleted (see next paragraph for removal constraints).
Once you have removed the outliers, click on the recompute
 button if you want to re-analyze the data on the edited chart.
You can use the undo ![]() and redo
and redo ![]() buttons to cancel and restore your changes. The restore
buttons to cancel and restore your changes. The restore ![]() button cancels all your changes and restore original data.
button cancels all your changes and restore original data.
Click on the Save ![]() button in the Top bar to save changes to the document.
button in the Top bar to save changes to the document.
Shear rate chart
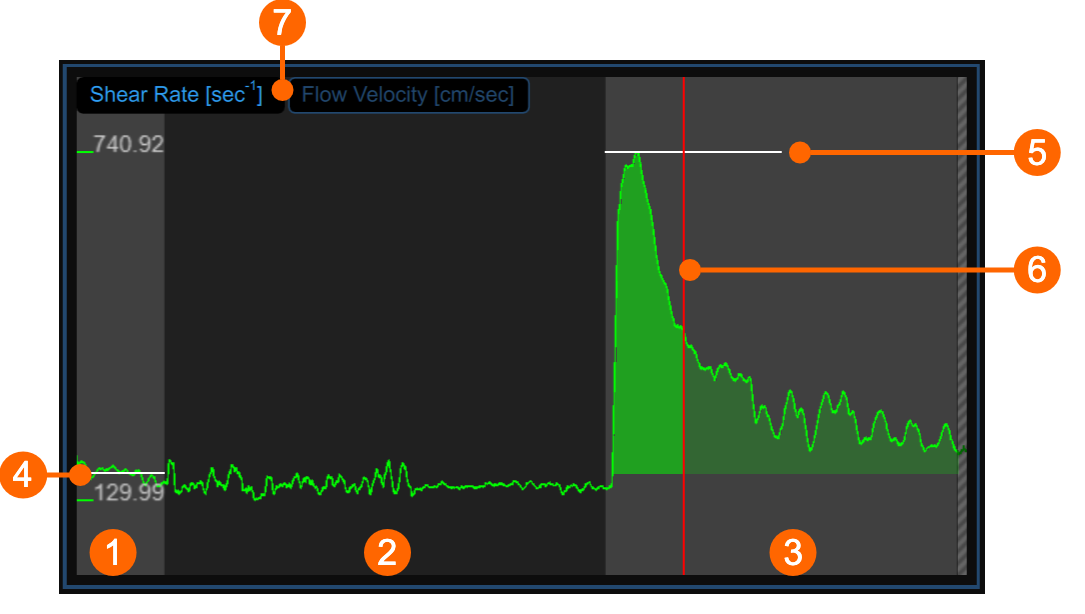
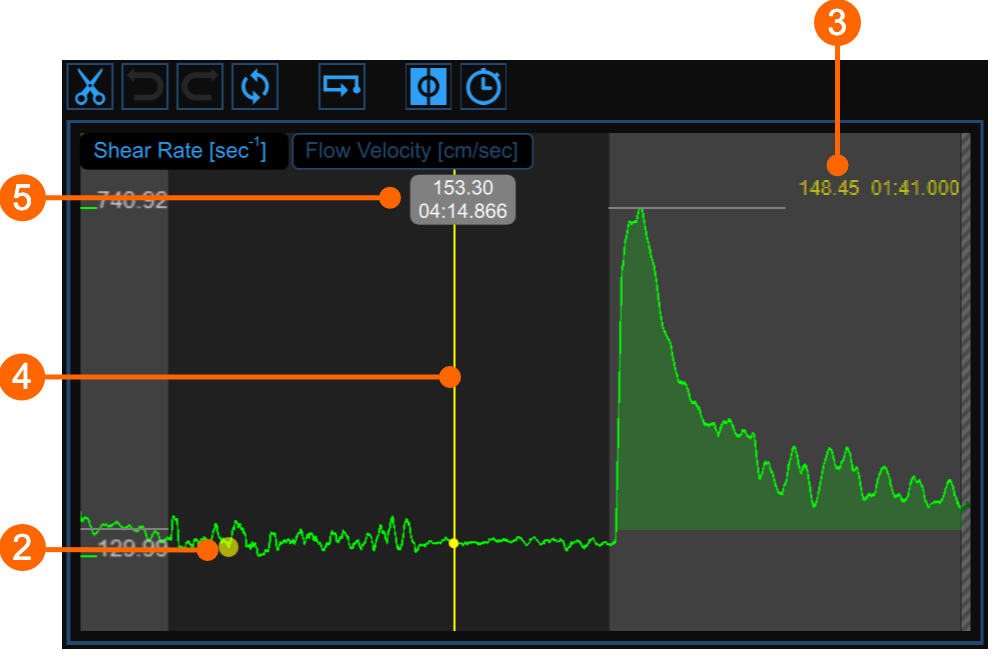
The chart shows the trend of the time averaged positive Shear Rate (or the time averaged positive Flow Velocity, according to selector (7)) during the examination. The chart is divided into three or two parts, according to the study modality. You have basal (1), ischemia (2) and vasodilation (3) intervals in FMD; ischemia is missing in vasodilation modality.
In the chart, two cursors are present: the first one (4) is placed at the baseline value; the second one (5) is placed at the maximum value in vasodilation. A third cursors (6) is shown at the time value corresponding to the maximum value of the diameter when the same cursor is selected in the Mean diameter chart . Cardiovascular Suite places the cursors at the position automatically computed at the end of the analysis. You can manually place these values if you see that some outliers have affected the automatic analysis.
These values are shown in the Results panel.
Graph cursors
As shown in the following figures, the Cursor ![]() button (1) activates a cursor (2) on the Mean Diameter chart and the Shear Rate chart that shows the current time position on the graph according to the images shown in the Video window. The diameter/shear rate values and shown in (3). When the Cursor button is active, it is also possible to know the coordinates of an exact point in the graph; hovering over the chart a second cursor (4) is displayed. It follows the mouse movements and the diameter/shear rate and the time values are shown in the label (5).
button (1) activates a cursor (2) on the Mean Diameter chart and the Shear Rate chart that shows the current time position on the graph according to the images shown in the Video window. The diameter/shear rate values and shown in (3). When the Cursor button is active, it is also possible to know the coordinates of an exact point in the graph; hovering over the chart a second cursor (4) is displayed. It follows the mouse movements and the diameter/shear rate and the time values are shown in the label (5).
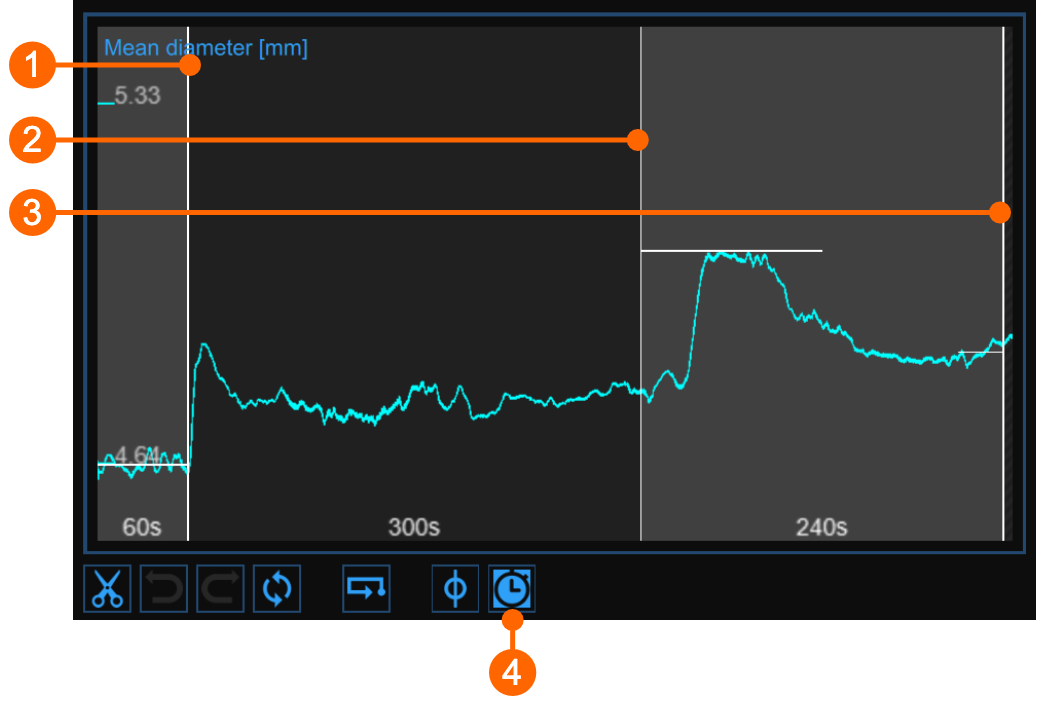
Modifying the timeline
Click the Timeline
 button
(4)
.
button
(4)
.
Move the vertical cursors that are place at the end-baseline (1) , end-ischemia (2) and end-vasodilation (3) .
Alerts
In FMD Studio Review you can cut and delete data from the mean diameter chart. Please, note that timeline constraints are already valid (see Timeline management paragraph in Setup panel).
After data removal, if there are intervals with a duration lower than the suggested value or than the allowed value, a yellow (![]() ) or red (
) or red (![]() ), respectively, alert icon will appear next to the parameters that can be affected by the too short time interval. In addition, if the intervals do not meet the minimum duration allowed value some parameters will not be calculated. You can hover over the icons and an informative message about the warning or error situation will be displayed.
), respectively, alert icon will appear next to the parameters that can be affected by the too short time interval. In addition, if the intervals do not meet the minimum duration allowed value some parameters will not be calculated. You can hover over the icons and an informative message about the warning or error situation will be displayed.
Video Window
The Video Window shows the video that has been analysed.
The Enlarge
![]() button enlarges the size of the video window.
button enlarges the size of the video window.
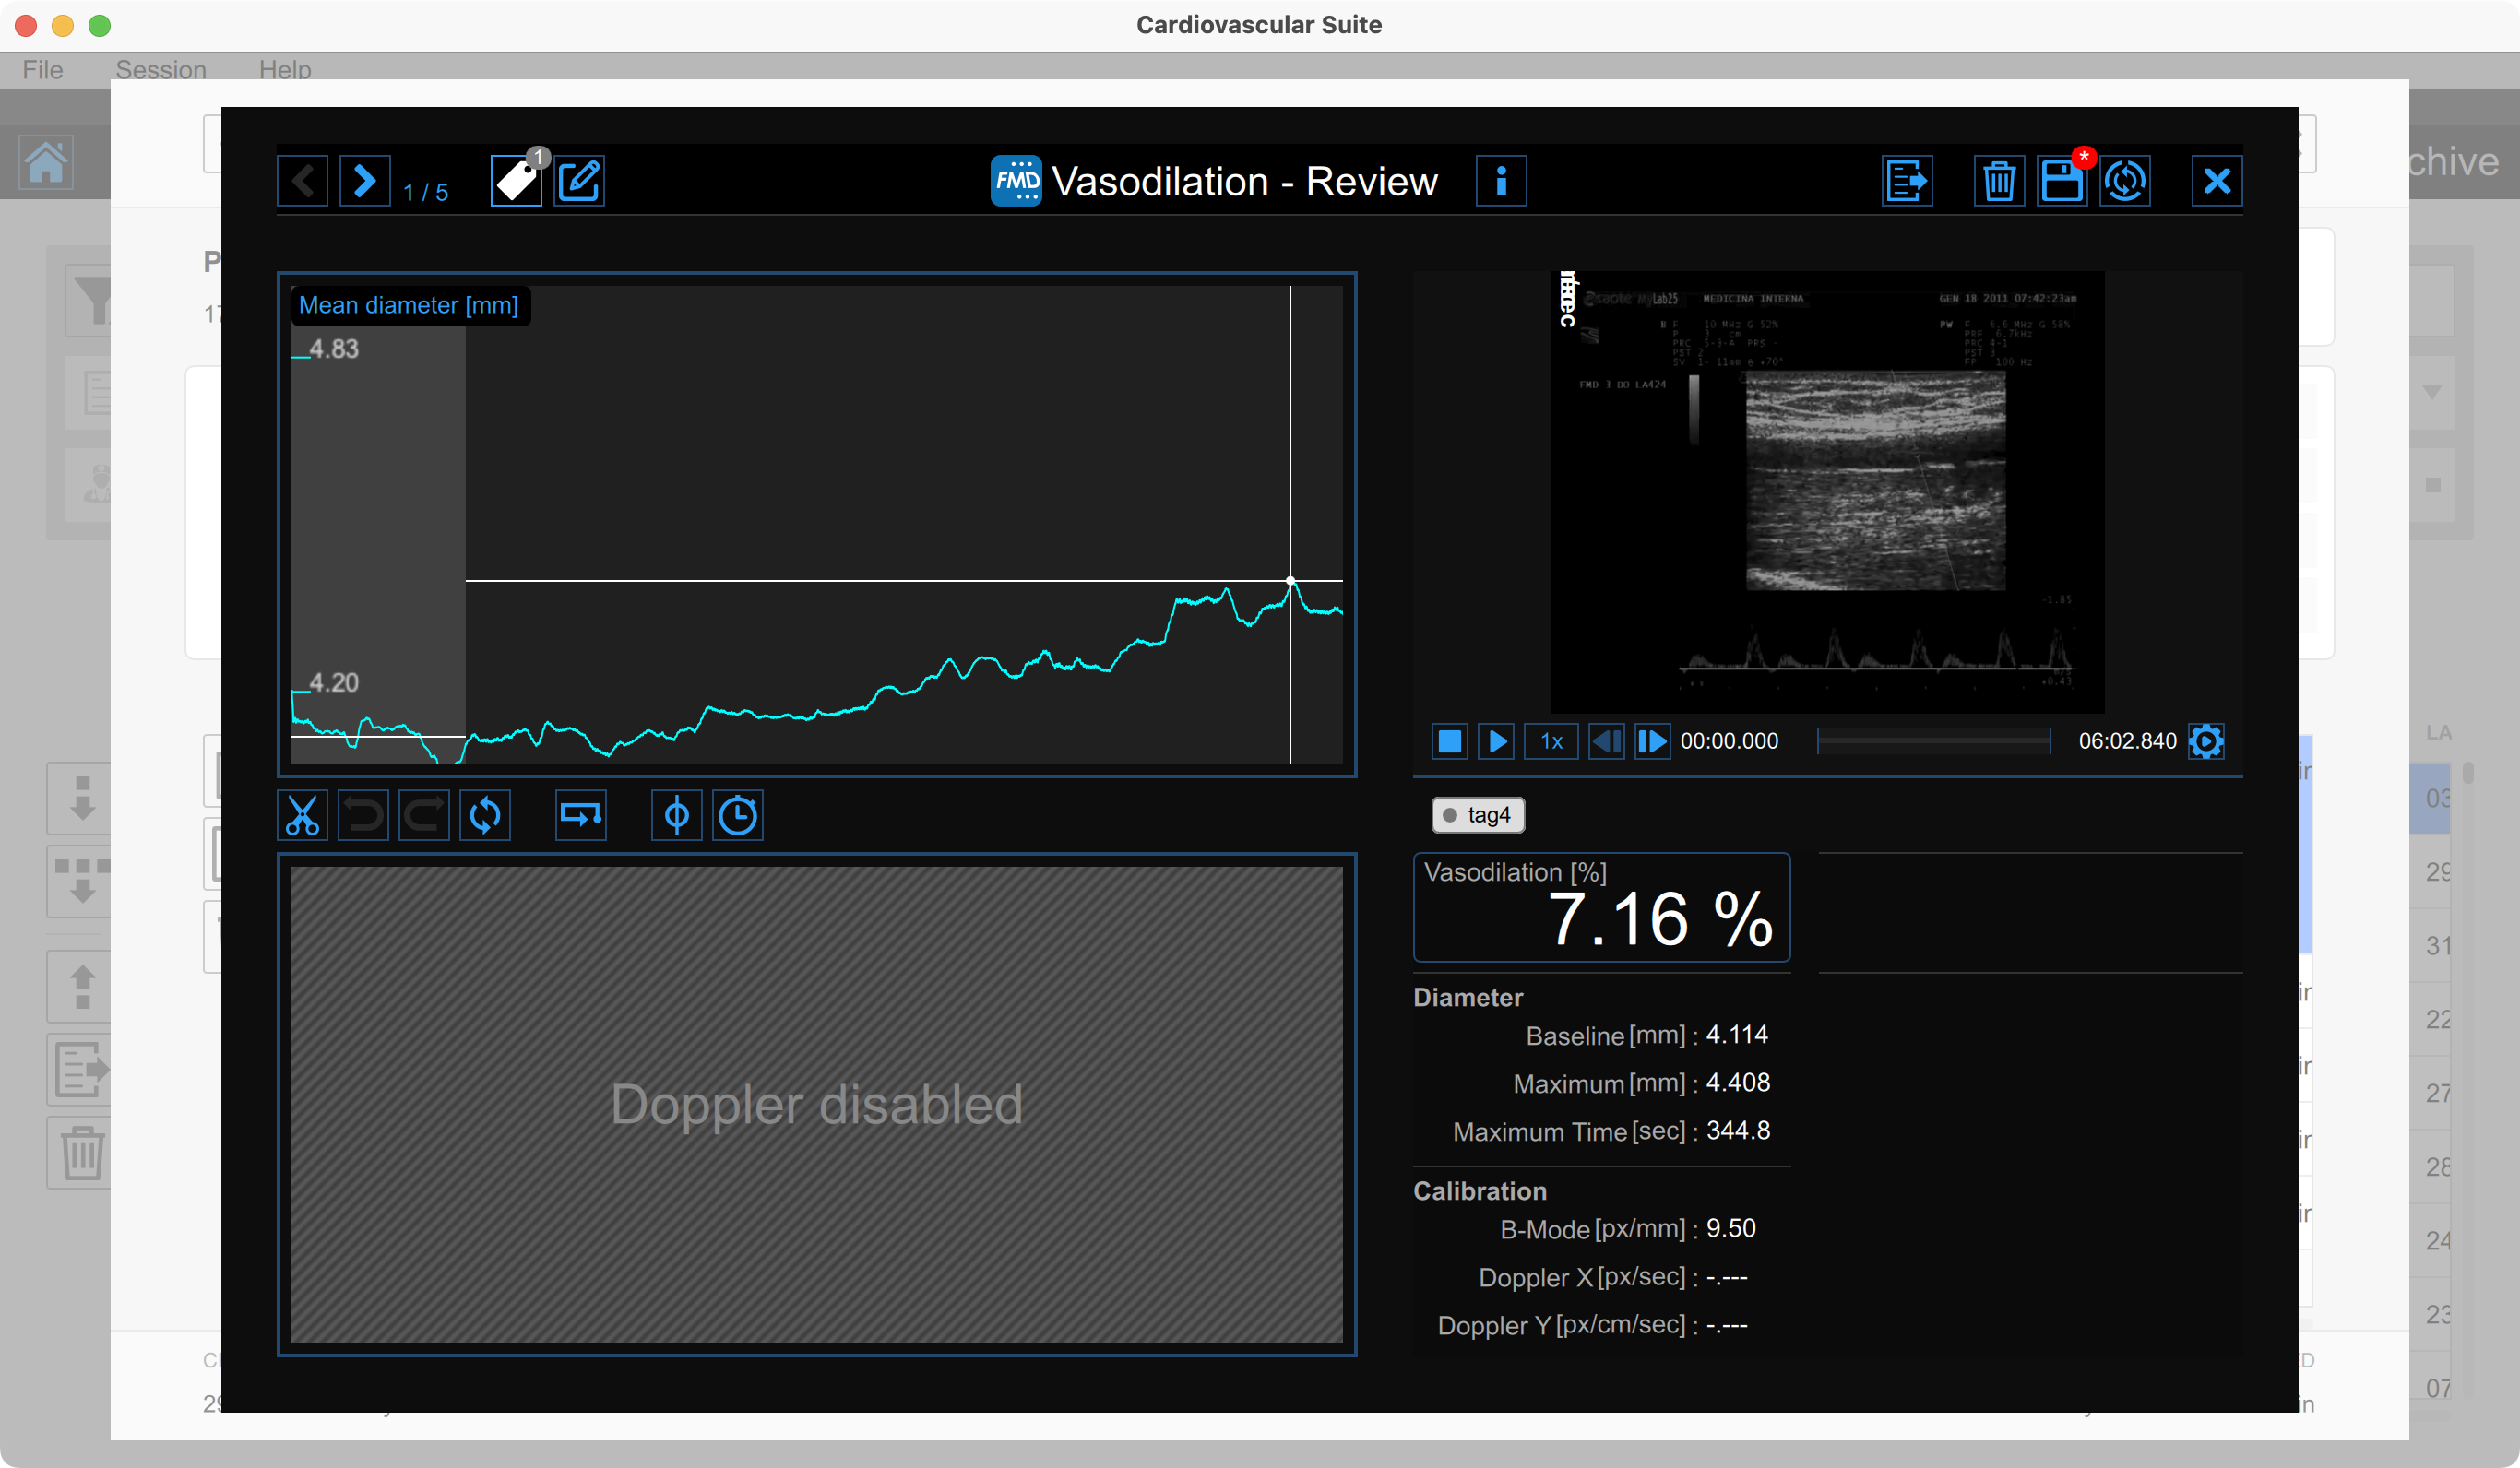
Results panel
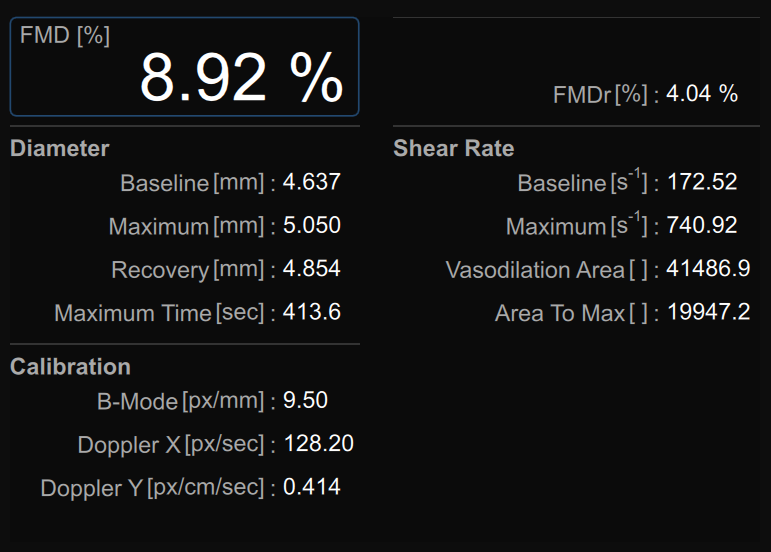
The panel shows the results of the analysis. The following data are displayed:
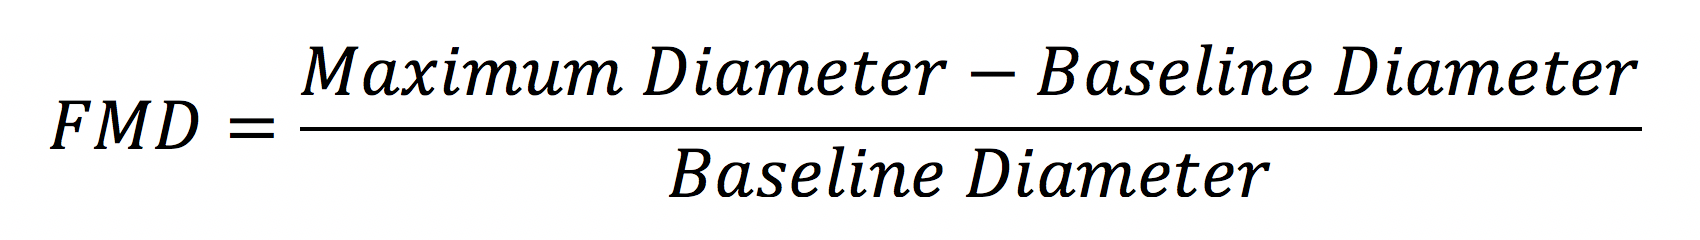
FMD [%]: Flow Mediated Dilation
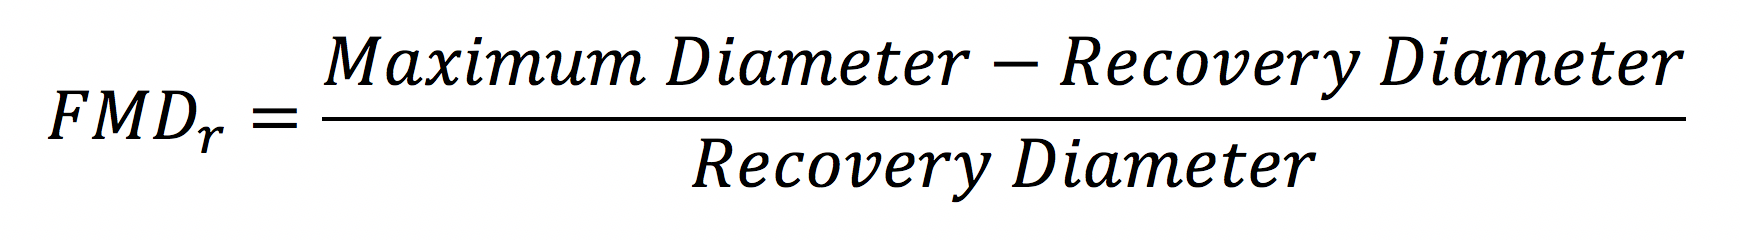
FMDr [%]: Flow Mediated Dilation with respect to the Recovery Diameter
Diameter
Baseline Diameter [mm]: mean of the diameter values in the "Baseline" time interval.
Maximum Diameter [mm]: maximum diameter value in the "Vasodilation" time interval.
Recovery Diameter [mm]: mean of the last 30 seconds of diameter values available in the "Vasodilation" time interval.
Maximum Time [sec]: time of the maximum diameter value in the "Vasodilation" time interval.
Calibration
B-Mode calibration value [px/mm]: value of the calibration of the B-mode image
Doppler X calibration value [px/sec]: value of calibration of the x axis (time) of PW Doppler
Doppler Y calibration value [px/cm/sec]: value of calibration of the y axis (velocity) of PW Doppler
Shear Rate (visible when the shear rate chart is visible)
Baseline Shear Rate [s-1]: mean of the shear rate values in the Baseline time interval.
Maximum Shear Rate [s-1]: maximum of the shear rate values in the Vasodilation time interval.
Vasodilation Area [dimensionless]: area under the curve of the shear rate in the Vasodilation time interval, calculated with reference to the baseline shear rate value (Fig. 1).
Area to Max [dimensionless]: area under the curve of the shear rate in the time interval that begins with the Vasodilation and ends at the time of the Maximum Diameter, calculated with reference to the baseline shear rate value (Fig. 2).
Flow Velocity (visible when the flow velocity chart is visible)
Baseline Flow Velocity [cm/sec]: mean of the flow velocity values in the Baseline time interval.
Maximum Flow Velocity [cm/sec]: maximum of the flow velocity values in the Vasodilation time interval.
Vasodilation Area [cm]: area under the curve of the flow velocity in the Vasodilation time interval, calculated with reference to the baseline flow velocity value (Fig. 1).
Area to Max [cm]: area under the curve of the flow velocity in the time interval that begins with the Vasodilation and ends at the time of the Maximum Diameter, calculated with reference to the baseline flow velocity value (Fig. 2).
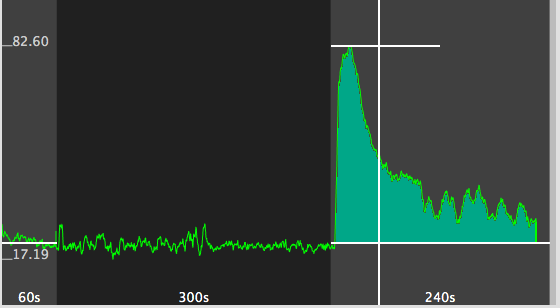
Figure 1 - Area
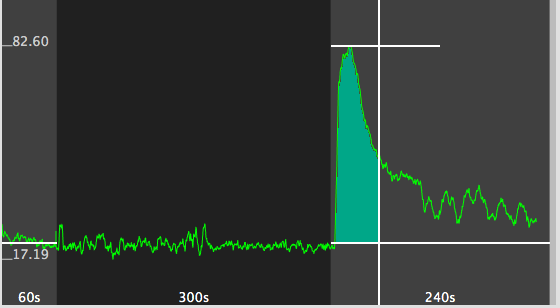
Figure 2 - Area to Max