Mean diameter chart
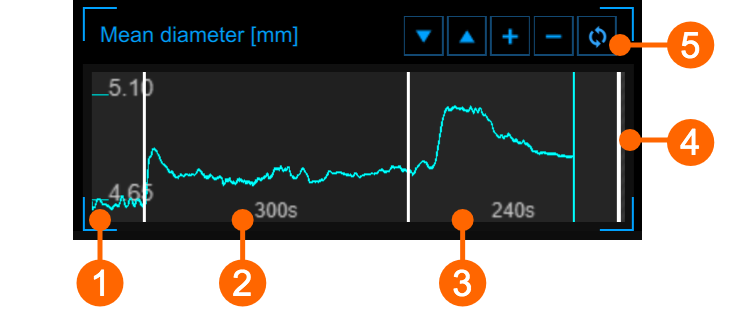
The chart shows the trend of the mean diameter during the examination. The chart is divided into three or two parts, according to the study modality. You have basal (1), ischemia (2) and vasodilation (3) in FMD; ischemia is missing in vasodilation modality. In offline mode, a fourth part (4) may be present if the time length of the video is greater than the sum of the basal + (ischemia) + vasodilation.
You can set the timeline by moving the three (two) vertical cursors that are present at end-baseline, end-ischemia and end-vasodilation.
Using the buttons at the top right (5) you can move up ![]() or down
or down ![]() the chart, enlarge
the chart, enlarge ![]() or reduce
or reduce ![]() the vertical scale or restore
the vertical scale or restore ![]() the default view.
the default view.