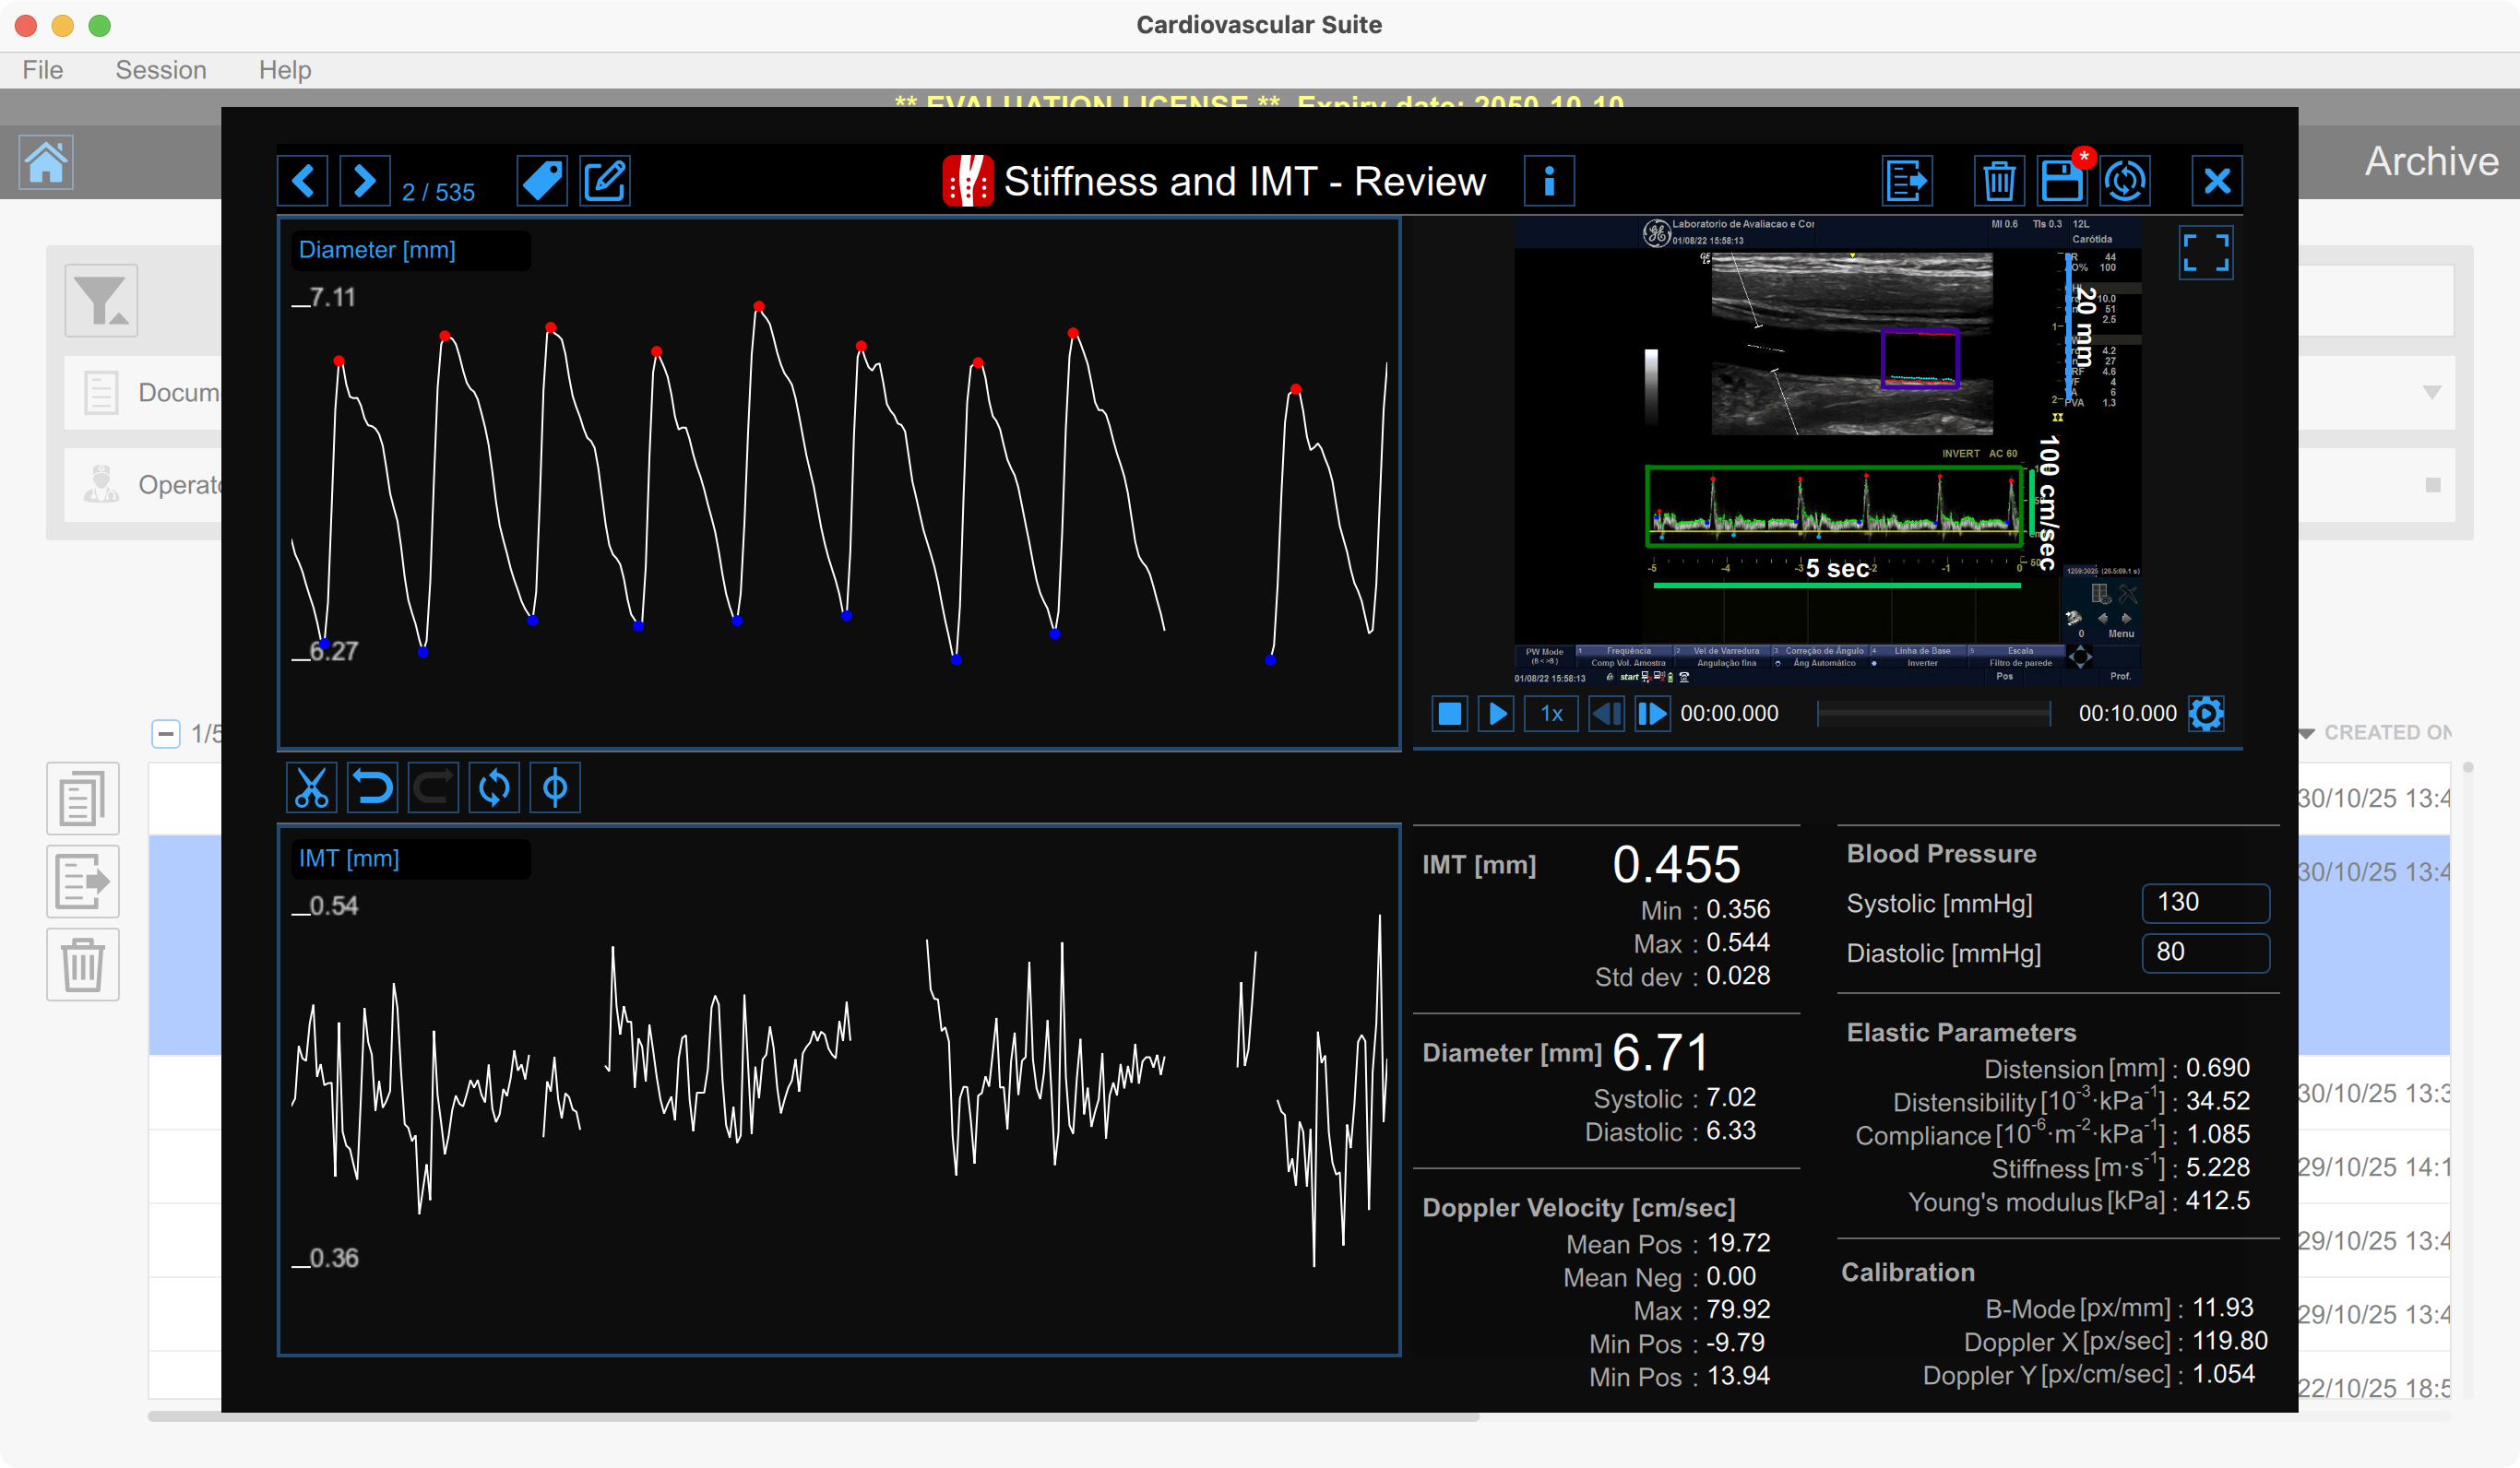
Results - Stiffness and IMT
The Review window shows the result of the analysis and allows you to remove piece of data that are considered to be "outliers".
Diameter chart
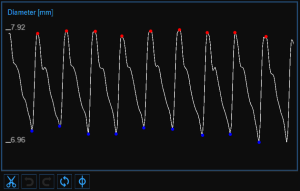
The chart shows the trend of the diameter. The buttons on the bottom can be used for editing the chart and removing the outliers.
Removing the outliers
Click the Cut
 button. The heart cycle will be highlighted in the diameter chart.
Click the cardiac cycles you want to remove.
Once you have removed the outliers, the data on the Results panel will be automatically updated.
You can use the undo ![]() and redo
and redo ![]() buttons to cancel and restore your changes. The Restore
buttons to cancel and restore your changes. The Restore ![]() button cancels all your changes and restore original data.
button cancels all your changes and restore original data.
Click on the Save ![]() button in the Top Bar to save changes to the document.
button in the Top Bar to save changes to the document.
IMT chart
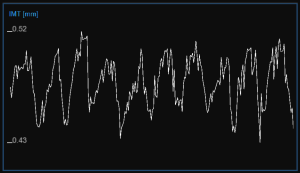
The chart shows the trend of the IMT. The buttons at the top can be used for editing the chart and removing the outliers.
Removing the outliers
Click on the Cut
button.
In the IMT chart, click on one of the two extremes of the range to be deleted.
Drag the mouse horizontally to the other extreme of the range to be deleted.
Once you have removed the outliers, the data on the Results panel will be automatically updated.
You can use the undo ![]() and redo
and redo ![]() buttons to cancel and restore your changes. The restore
buttons to cancel and restore your changes. The restore ![]() button cancels all your changes and restore original data.
button cancels all your changes and restore original data.
Click on the Save ![]() button in the Top Bar to save changes to the document.
button in the Top Bar to save changes to the document.
Graph cursors
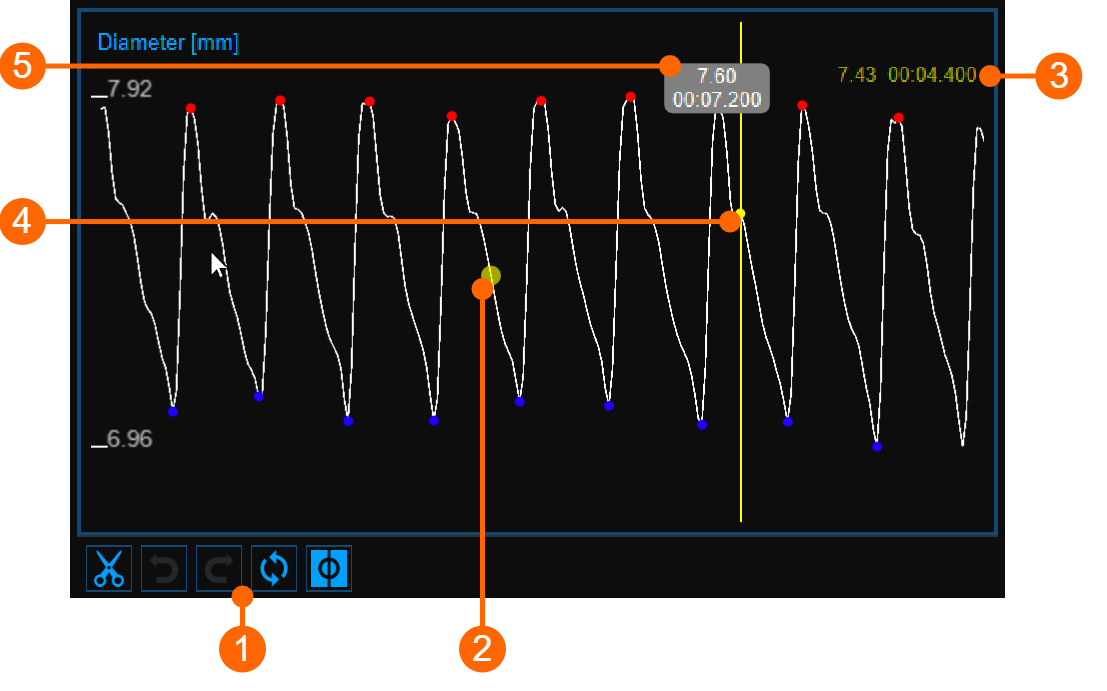
The Cursor ![]() button (1) activates a cursor (2) on the Diameter and on the IMT chart, which shows the current time position on the graph according to the images shown in the Video window. The diameter/IMT value and the time value are shown in (3). When the Cursor button is active, it is also possible to know the coordinates of an exact point in the graph; hovering over the chart and a second cursor (4) is displayed. It follows the mouse movements and the diameter/IMT value and the time value are shown in the label (5).
button (1) activates a cursor (2) on the Diameter and on the IMT chart, which shows the current time position on the graph according to the images shown in the Video window. The diameter/IMT value and the time value are shown in (3). When the Cursor button is active, it is also possible to know the coordinates of an exact point in the graph; hovering over the chart and a second cursor (4) is displayed. It follows the mouse movements and the diameter/IMT value and the time value are shown in the label (5).
Video Window
The Video Window shows the video that has been analysed.
The Enlarge
![]() button enlarges the size of the video window.
button enlarges the size of the video window.
Results panel
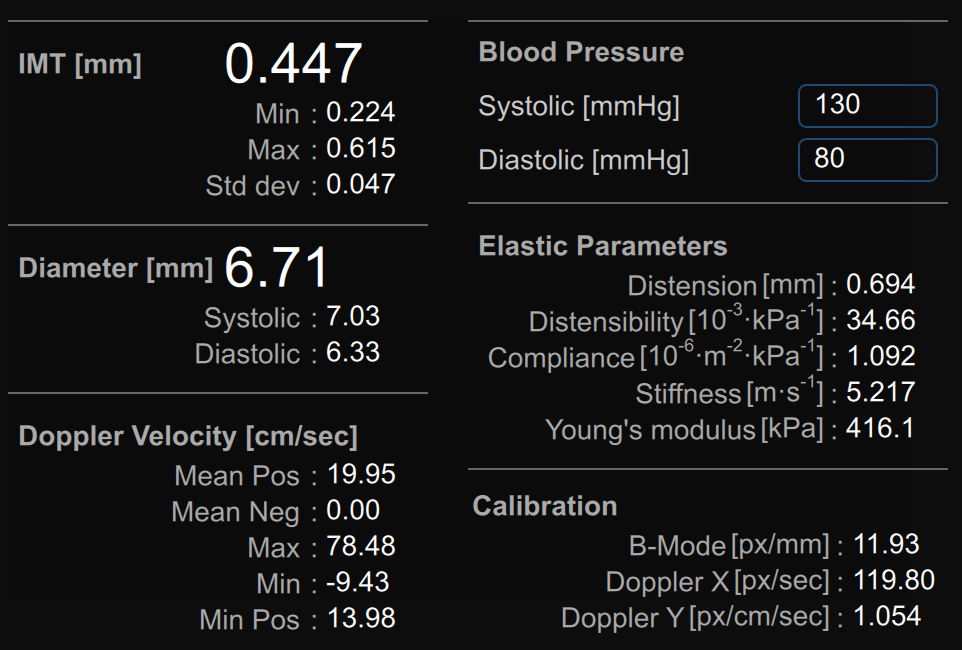
The panel shows the results of the analysis. The following data are displayed:
IMT [mm]: Intima Media Thickness. It is computed as an average value of the data present in the IMT chart.
Min IMT [mm]: minimum value of Intima Media Thickness. It is computed on the data present in the IMT chart.
Max IMT [mm]: maximum value of Intima Media Thickness. It is computed on the data present in the IMT chart.
Std. dev IMT [mm]: standard deviation of Intima Media Thickness. It is computed on the data present in the IMT chart.
Diameter [mm]: value of the average diameter. It is computed as an average value of the diameter data present in the Diameter chart.
Systolic diameter [mm]: value of the diameter in systole. It is computed as an average value of the systolic diameters present in the Diameter chart.
Diastolic diameter [mm]: value of the diameter in diastole. It is computed as an average value of the diastolic diameters present in the Diameter chart.
Mean Pos Doppler Velocity[cm/sec]: average of the positive Doppler velocity values. It is computed as an average on all the analysed image sequence.
Mean Neg Doppler Velocity[cm/sec]: average of the negative Doppler velocity values. It is computed as an average on all the analysed image sequence.
Max Doppler Velocity[cm/sec]: maximum value of the Doppler velocity. It is computed averaging the maxima on all the analysed image sequence.
Min Doppler Velocity[cm/sec]: minimum value of the Doppler velocity. It is computed averaging the minima on all the analysed image sequence.
Min Pos Velocity[cm/sec]: minimum value of the positive Doppler velocity. It is computed averaging the minima on all the analysed image sequence.
Blood pressure [mmHg]: diastolic pressure and systolic pressure.
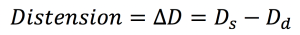
Distension [mm]: stroke change in diameter.
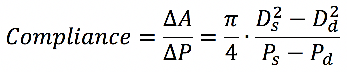
Compliance [10-6·m2·kPa-1]: absolute change in lumen area for a given pressure change.
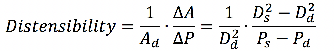
Distensibility [10-3· kPa-1]: relative change in lumen area during systole for a given pressure change.
Carotid Stiffness [m·s-1]: Stiffness value computed by Bramwell-Hill equation.

Young’s elastic modulus [kPa]:
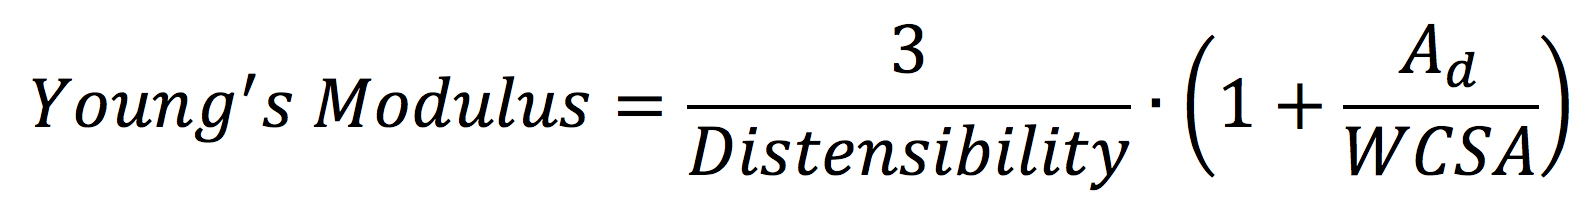
where:
De = External Diameter (between the media-adventitia interfaces) measured in diastole.
Di = Internal Diameter (between the lumen-intima interfaces) measured in diastole.
Ds = Systolic Diameter (external).
Dd = Diastolic Diameter (external), Dd = De
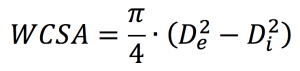
WCSA = Wall Cross Section Area
ΔA = Stroke change in lumen area.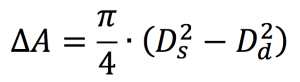
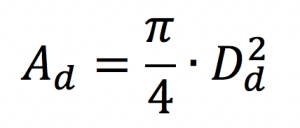
Ad = Diastolic Area.
Ps = Systolic Pressure.
Pd = Diastolic Pressure.
ΔP = Ps - Pd
ρ = Blood density: is assumed to be constant and equal to 1.06 g/cm3.
B-mode Calibration [px/mm]: value of the b-mode calibration.
Doppler X Calibration [px/sec]: value of theDoppler X calibration.
Doppler Y Calibration [px/cm/sec]: value of theDoppler Y calibration.