Setup panel
The setup panel contains the commands to set the timeline of the exam, to calibrate the B-mode and the Doppler flow images, to set the diameter and Doppler flow ROIs and to choose the sensitivity of the algorithm. You can move among the panels by using the Next ![]() button and the Previous
button and the Previous ![]() button. The Next button is enabled only if you have set all the mandatory field in the panel.
button. The Next button is enabled only if you have set all the mandatory field in the panel.
Study modality and timeline setup
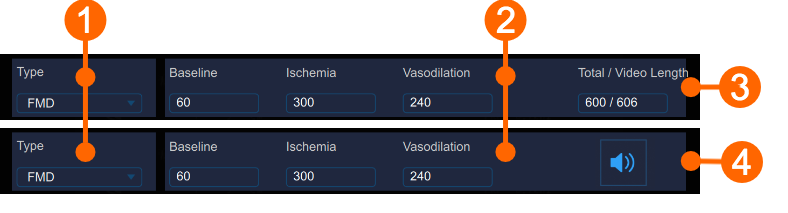
In (1), you can select the study types. FMD Studio can work in two modalities: "FMD" and "Vasodilation". The two modalities differ in how the timeline of the examination is organized.
In FMD modality, the timeline is divided into three parts:
Baseline, where the software computes the baseline diameter and the baseline shear-rate.
Ischemia, which is not used for the analysis.
Vasodilation, where the software computes the maximum diameter, the recovery diameter, the maximum shear-rate and the area under the curve of the shear-rate.
In Vasodilation modality, the timeline is divided into two parts:
Baseline, where the software computes the baseline diameter and the baseline shear-rate.
Vasodilation, where the software computes the maximum diameter, the maximum shear-rate and the area under the curve of the shear-rate.
The time length of the timeline parts can be set in the Time panel (2). In the Time Panel, you can choose the time length of baseline, ischemia and vasodilation (ischemia is present only in "FMD" modality) intervals.
In Offline analysis (3), the Time panel shows the total length of baseline + ischemia + vasodilation, and the video length. In Online analysis (4), the panel contains the control indicating if the acoustic alert is Enabled ![]() or Disabled
or Disabled ![]() (click on the icon to change its status). In enabled, an acoustic signal is played at the end of the baseline and the ischemia time interval.
(click on the icon to change its status). In enabled, an acoustic signal is played at the end of the baseline and the ischemia time interval.
Once the time lengths have been set, click on the Next ![]() button to proceed.
button to proceed.
Timeline management
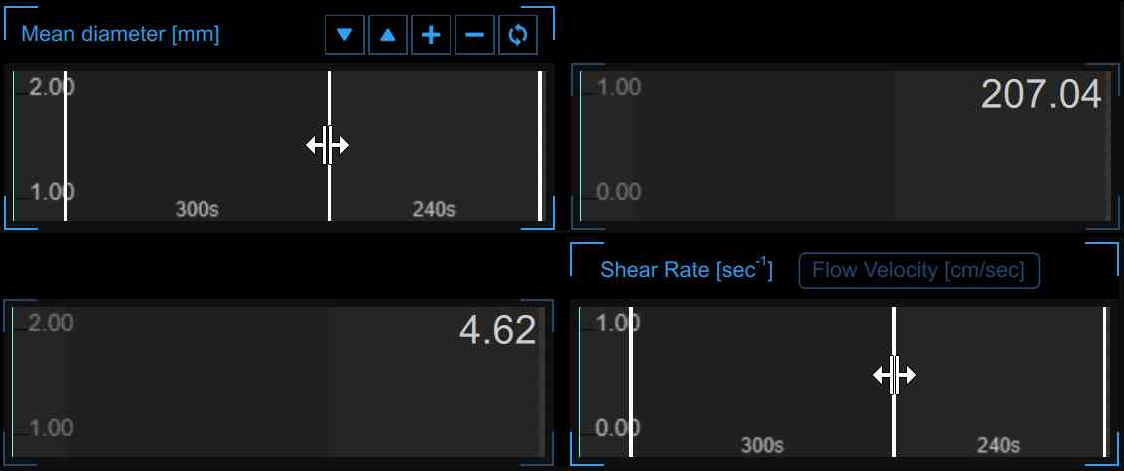
User can set and modify the time length entering values into the Text Fields (see previous picture) but also dragging one of the vertical cursors in graphs, as shown in the following picture:
FMD Studio allows the users to manage the timeline in a flexible way able to meet their clinical and/or research needs. There are constraints on the timeline in terms of minimum and maximum allowed values for each interval (you can not set values outside the allowed range and, if the video modality is "Offline analysis", the sum of the intervals cannot be grater than the time length of the video file under examination). There are also suggested minimum values: if the user decides to ignore this advice, the analysis will be performed anyway but there will be a yellow alert icon (![]() ) next to the values that may not be reliable in that configuration. In the following table allowed and suggested values are shown:
) next to the values that may not be reliable in that configuration. In the following table allowed and suggested values are shown:
|
Timeline constraints (in seconds) |
|||
|
|
Baseline |
Ischemia |
Vasodilation |
|
FMD |
5* - 180 |
0 - 420 |
5** - 1200 |
|
Vasodilation |
5* - 300 |
- |
5 - 1500 |
|
* we suggest a basal period of at least 20 sec. ** we suggest a vasodilation period of at least 120 sec. |
|||
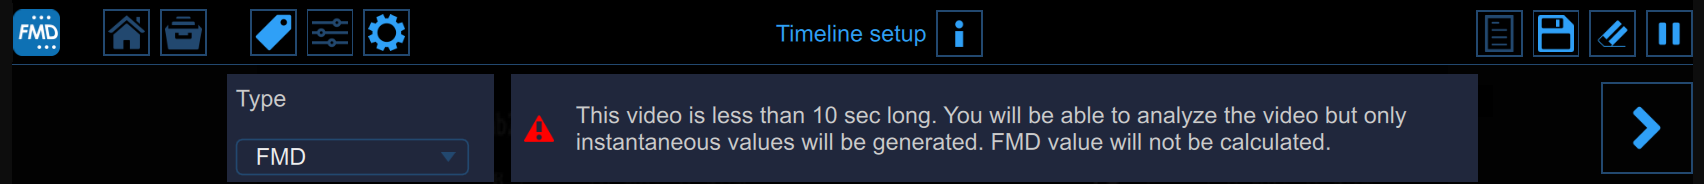
If the user uploads a video clip (for offline analysis) with a lower duration than the minimum allowed values (it means 10 seconds; 5 for baseline and 5 for vasodilation) an error message will appear: "This video is less than 10 sec long. You will be able to analyse the video but only instantaneous values will be generated. FMD value will not be calculated."
In this configuration user cannot set the timeline and characteristics parameters (e.g. FMD, FMDr, baseline diameter,...) will not be computed but only instantaneous values will be generated.
You can hover over the yellow icon (![]() ) or the red one (
) or the red one (![]() ) and an informative message about the warning or error situation will be displayed.
) and an informative message about the warning or error situation will be displayed.
B-mode image setup
The B-Mode Panel must be used to Calibrate the B-mode image and to set the diameter ROI.
Calibration
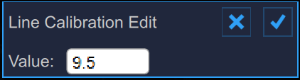
The Set B-Mode Calibration ![]() button is used to Calibrate the B-mode image.
button is used to Calibrate the B-mode image.
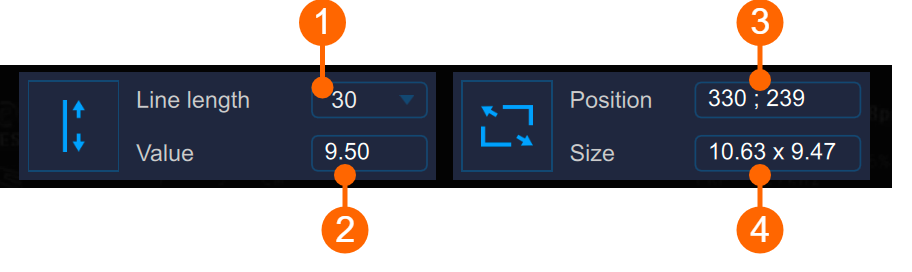
The drop down menu (1) shows the length of the line used for the calibration.
The numeric display (2) shows the calibration value.
If you click in the value field, you are allowed to manually enter the calibration value in the editable field (if you already know the value). Then click the Save button to save the values.
ROI
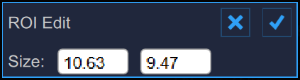
The Set B-Mode ROI ![]() button is used to set the diameter ROI.
button is used to set the diameter ROI.
The numeric display (3) shows the center position, in pixels, of the diameter ROI.
The numeric display (4) shows the size (width x height), in mm, of the diameter ROI.
If you click in the value field, you are allowed to manually enter the ROI position and size values in the editable fields (if you already know the values). The click the Save button to enter the values.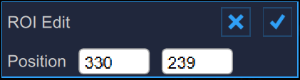
Once you have calibrated the B-Mode image and set the Diameter ROI, click on the Next ![]() button to proceed.
button to proceed.
Doppler Setup
The Doppler Panel must be used to Calibrate the Doppler flow image and to set the Doppler flow ROI.
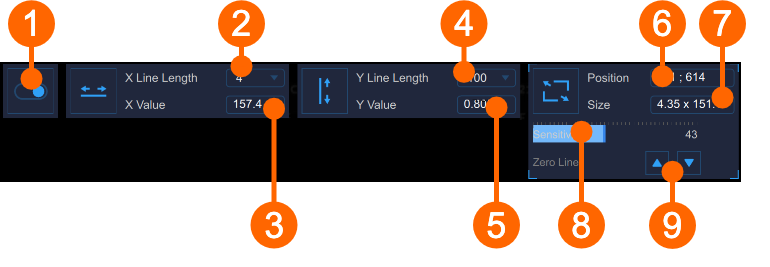
The switch (1) enables and disables the Doppler Flow analysis.
Calibration
The Set Doppler X-Calibration ![]() button is used to calibrate the x-axis (time).
button is used to calibrate the x-axis (time).
The drop down menu (2) shows the length of the line used for the calibration (sec).
The numeric display (3) shows the x-calibration value (pix/sec).
The Set Doppler Y-Calibration ![]() button is used to calibrate the y-axis (velocity).
button is used to calibrate the y-axis (velocity).
The drop down menu (4) shows the length of the line used for the calibration (cm/sec).
The numeric display (5) shows the y-calibration value (pix/cm/sec).
ROI
The Set Doppler Flow ROI ![]() button is used to set the Doppler flow ROI.
button is used to set the Doppler flow ROI.
The numeric display (6) shows the center position, in pixels, of the Doppler flow ROI.
The numeric display (7) shows the size (width x height), in pixels, of the Doppler flow ROI.
The sensitivity of the Doppler Flow analysis algorithm is set by the slider (8).
The position of the zero line can be adjusted by the buttons (9).
Once you have calibrated the B-Mode image and set the Diameter ROI, click on the Next ![]() button to proceed.
button to proceed.