Results panel
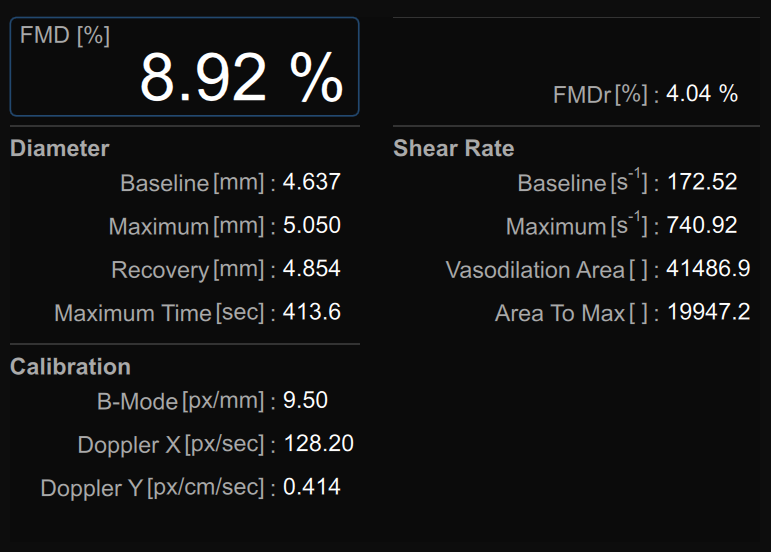
The panel shows the results of the analysis. The following data are displayed:
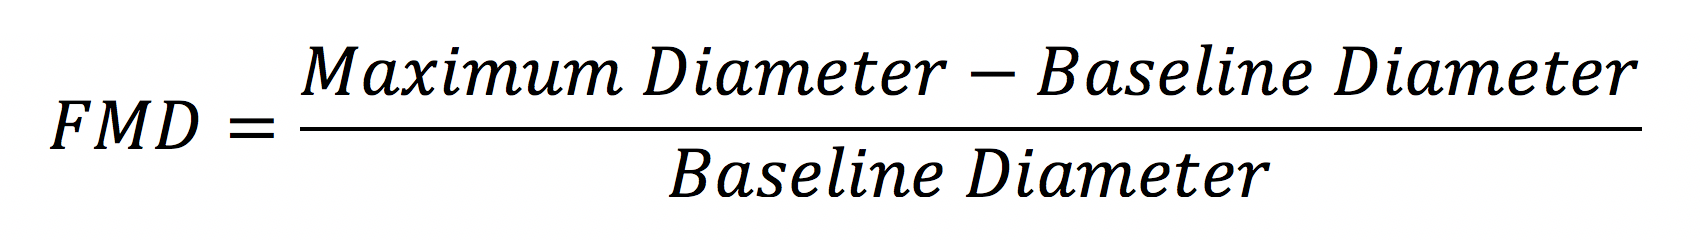
FMD [%]: Flow Mediated Dilation
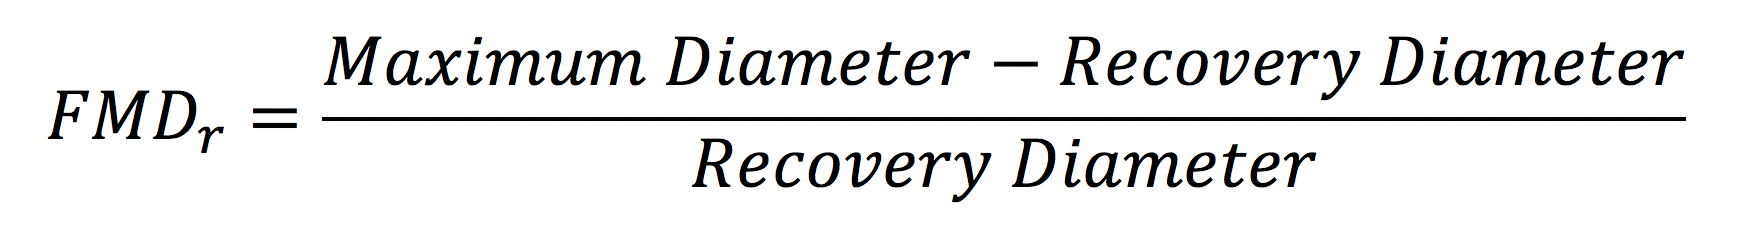
FMDr [%]: Flow Mediated Dilation with respect to the Recovery Diameter
Diameter
Baseline Diameter [mm]: mean of the diameter values in the "Baseline" time interval.
Maximum Diameter [mm]: maximum diameter value in the "Vasodilation" time interval.
Recovery Diameter [mm]: mean of the last 30 seconds of diameter values available in the "Vasodilation" time interval.
Maximum Time [sec]: time of the maximum diameter value in the "Vasodilation" time interval.
Calibration
B-Mode calibration value [px/mm]: value of the calibration of the B-mode image
Doppler X calibration value [px/sec]: value of calibration of the x axis (time) of PW Doppler
Doppler Y calibration value [px/cm/sec]: value of calibration of the y axis (velocity) of PW Doppler
Shear Rate (visible when the shear rate chart is visible)
Baseline Shear Rate [s-1]: mean of the shear rate values in the Baseline time interval.
Maximum Shear Rate [s-1]: maximum of the shear rate values in the Vasodilation time interval.
Vasodilation Area [dimensionless]: area under the curve of the shear rate in the Vasodilation time interval, calculated with reference to the baseline shear rate value (Fig. 1).
Area to Max [dimensionless]: area under the curve of the shear rate in the time interval that begins with the Vasodilation and ends at the time of the Maximum Diameter, calculated with reference to the baseline shear rate value (Fig. 2).
Flow Velocity (visible when the flow velocity chart is visible)
Baseline Flow Velocity [cm/sec]: mean of the flow velocity values in the Baseline time interval.
Maximum Flow Velocity [cm/sec]: maximum of the flow velocity values in the Vasodilation time interval.
Vasodilation Area [cm]: area under the curve of the flow velocity in the Vasodilation time interval, calculated with reference to the baseline flow velocity value (Fig. 1).
Area to Max [cm]: area under the curve of the flow velocity in the time interval that begins with the Vasodilation and ends at the time of the Maximum Diameter, calculated with reference to the baseline flow velocity value (Fig. 2).
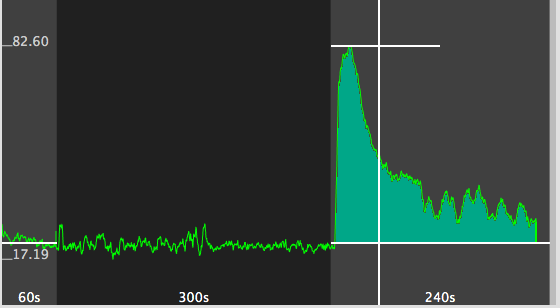
Figure 1 - Area
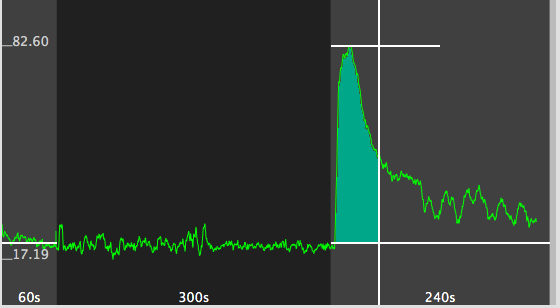
Figure 2 - Area to Max
These data can also be exported in different formats. See here for export details.